| Param | Original file | Final file |
|---|---|---|
| Filename | modeM0/AS1A05_180T01_9000002986cztM0_level2_bc.evt | modeM0/AS1A05_180T01_9000002986cztM0_level2_quad_clean.evt |
| Size (bytes) | 3,289,867,200 | 1,318,610,880 |
| Size | 3.1 GB | 1.2 GB |
| Events in quadrant A | 22,242,368 | 8,734,614 |
| Events in quadrant B | 21,772,851 | 8,695,817 |
| Events in quadrant C | 19,978,476 | 8,344,340 |
| Events in quadrant D | 29,641,371 | 8,129,300 |
| Mode SS | |||
|---|---|---|---|
| Quadrant | BADHDUFLAG | Total packets | Discarded packets |
| A | 0 | 1798 | 0 |
| B | 0 | 1798 | 0 |
| C | 0 | 1798 | 0 |
| D | 0 | 1798 | 0 |
| Mode M9 | |||
|---|---|---|---|
| Quadrant | BADHDUFLAG | Total packets | Discarded packets |
| A | 0 | 162 | 0 |
| B | 0 | 162 | 0 |
| C | 0 | 162 | 0 |
| D | 0 | 162 | 0 |
| Mode M0 | |||
|---|---|---|---|
| Quadrant | BADHDUFLAG | Total packets | Discarded packets |
| A | 0 | 194751 | 0 |
| B | 0 | 192142 | 0 |
| C | 0 | 188584 | 0 |
| D | 0 | 220832 | 0 |
| Quadrant | Total seconds | Saturated seconds | Saturation percentage |
|---|---|---|---|
| A | 88075 | 1663 | 1.888163% |
| B | 88075 | 1476 | 1.675844% |
| C | 88075 | 1598 | 1.814363% |
| D | 88075 | 3348 | 3.801306% |
Noise dominated data is calculated using 1-second bins in cleaned event files. If a bin has >2000 counts, and if more than 50% of those come from <1% of pixels, then it is considered to be noise-dominated and hence unusable.
| Quadrant | # 1 sec bins | Bins with >0 counts | Bins with >2000 counts | High rate bins dominated by noise | Noise dominated (total time) | Noise dominated (detector-on time) | Marked lightcurve |
|---|---|---|---|---|---|---|---|
| A | 104325 | 88081 | 19 | 19 | 0.02% | 0.02% |  |
| B | 104325 | 88079 | 23 | 23 | 0.02% | 0.03% |  |
| C | 104325 | 88080 | 1 | 1 | 0.00% | 0.00% |  |
| D | 104325 | 88079 | 518 | 518 | 0.50% | 0.59% | 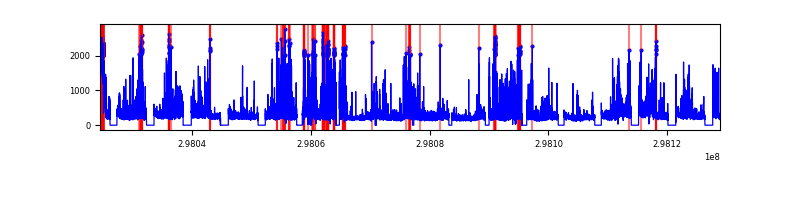 |
Top three noisy pixels from each quadrant. If the there are fewer than three noisy pixels in the level2.evt file, extra rows are filled as -1
| Pixel properties | Quadrant properties | ||||||
|---|---|---|---|---|---|---|---|
| Quadrant | DetID | PixID | Counts | Sigma | Mean | Median | Sigma |
| A | 14 | 238 | 771091 | 645.76 | 5350 | 5272 | 1185.9 |
| A | 5 | 16 | 475939 | 396.88 | 5350 | 5272 | 1185.9 |
| A | 14 | 254 | 228973 | 188.63 | 5350 | 5272 | 1185.9 |
| B | 0 | 198 | 230174 | 219.3 | 5339 | 5264 | 1025.6 |
| B | 4 | 80 | 202514 | 192.33 | 5339 | 5264 | 1025.6 |
| B | 0 | 189 | 183592 | 173.88 | 5339 | 5264 | 1025.6 |
| C | 7 | 220 | 136677 | 109.92 | 5088 | 5111 | 1196.9 |
| C | 3 | 233 | 107708 | 85.72 | 5088 | 5111 | 1196.9 |
| C | 4 | 254 | 103164 | 81.92 | 5088 | 5111 | 1196.9 |
| D | 1 | 52 | 6364732 | 5168.88 | 5201 | 5037 | 1230.4 |
| D | 7 | 38 | 1568347 | 1270.59 | 5201 | 5037 | 1230.4 |
| D | 12 | 218 | 567265 | 456.95 | 5201 | 5037 | 1230.4 |
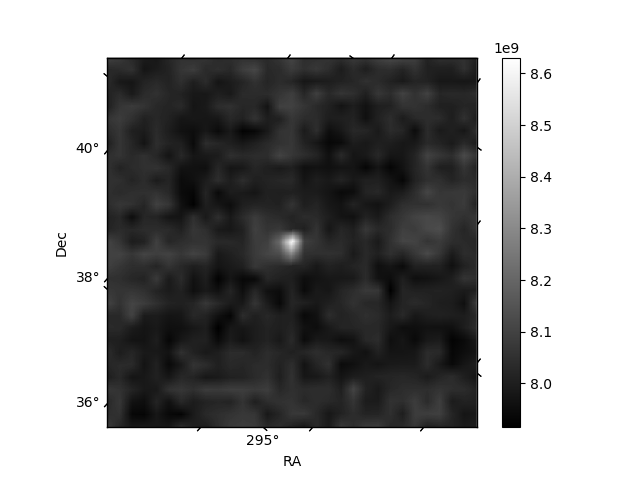
Histogram calculated using DETX and DETY for each event in the final _common_clean file
| Quadrant A |  |
 |
Quadrant B |
|---|---|---|---|
| Quadrant D |  |
 |
Quadrant C |
| Plot type | Count rate plots | Images |
|---|---|---|
| Comparison with Poisson distribution Blue bars denote a histogram of data divided into 1 sec bins. Red curve is a Poisson curve with rate = median count rate of data. |
 |
 |
| Quadrant-wise count rates Data is divided into 100 sec bins |
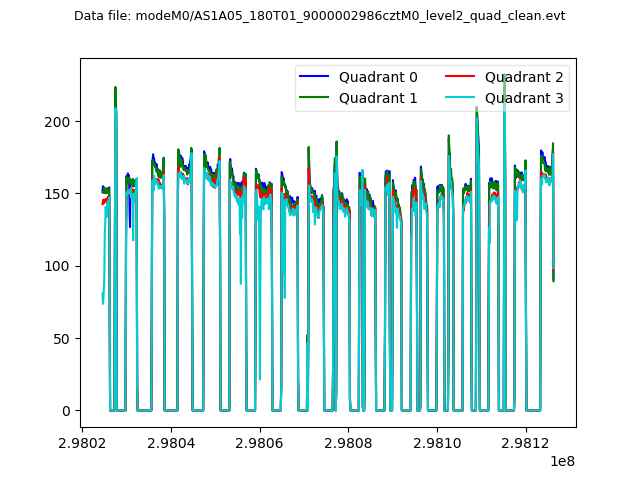 |
|
| Module-wise count rates for Quadrant A Data is divided into 100 sec bins |
 |
 |
| Module-wise count rates for Quadrant B Data is divided into 100 sec bins |
 |
 |
| Module-wise count rates for Quadrant C Data is divided into 100 sec bins |
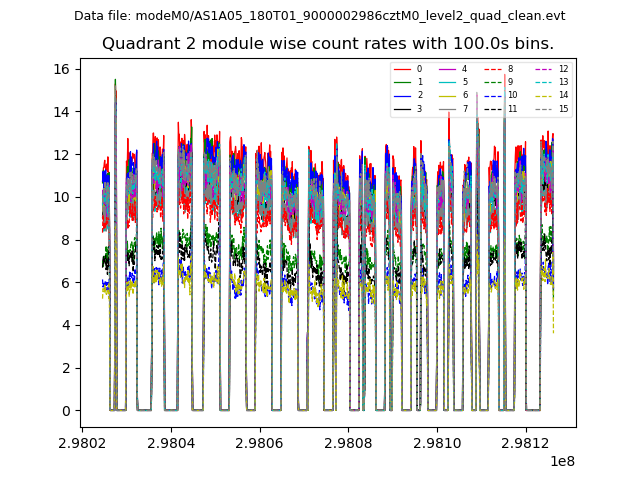 |
 |
| Module-wise count rates for Quadrant D Data is divided into 100 sec bins |
 |
 |
| Parameter | Plot |
|---|---|
| CZT HV Monitor |  |
| D_VDD |  |
| Temperature 1 | 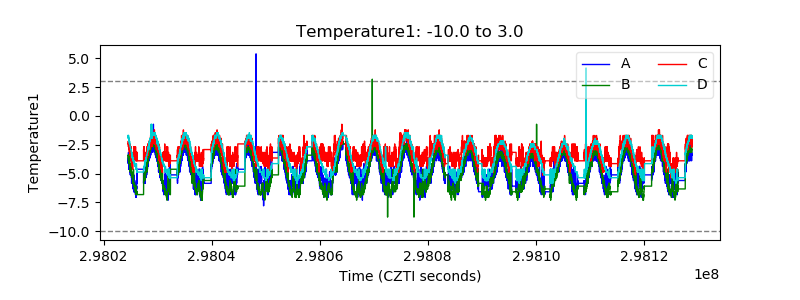 |
| Veto HV Monitor |  |
| Veto LLD | 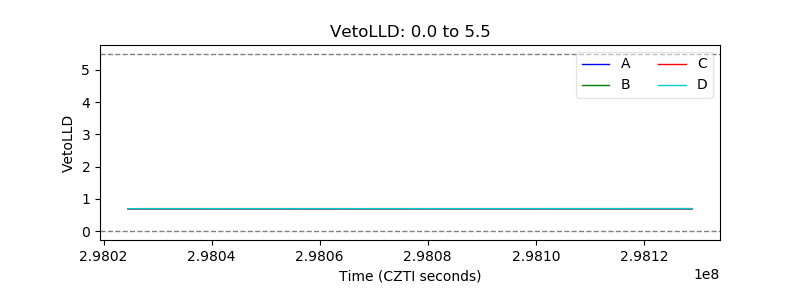 |
| Alpha Counter |  |
| _CPM_Rate |  |
| CZT Counter |  |
| +2.5 Volts monitor |  |
| +5 Volts monitor |  |
| _ROLL_ROT | 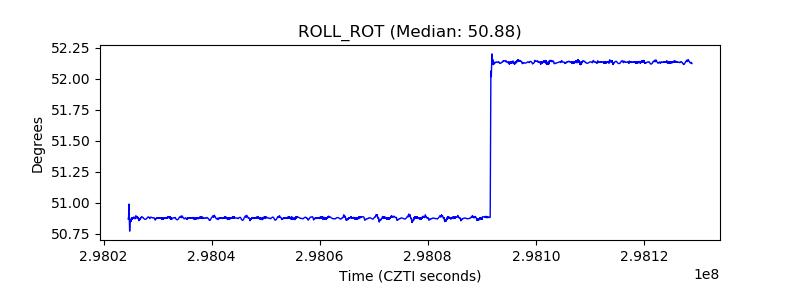 |
| _Roll_DEC |  |
| _Roll_RA |  |
| Veto Counter |  |