| Param | Original file | Final file |
|---|---|---|
| Filename | modeM0/AS1C04_001T01_9000002984cztM0_level2_bc.evt | modeM0/AS1C04_001T01_9000002984cztM0_level2_quad_clean.evt |
| Size (bytes) | 3,707,233,920 | 1,247,500,800 |
| Size | 3.5 GB | 1.2 GB |
| Events in quadrant A | 23,516,420 | 8,341,128 |
| Events in quadrant B | 19,582,029 | 8,401,463 |
| Events in quadrant C | 16,709,395 | 8,240,267 |
| Events in quadrant D | 47,133,135 | 7,429,501 |
| Mode SS | |||
|---|---|---|---|
| Quadrant | BADHDUFLAG | Total packets | Discarded packets |
| A | 0 | 1600 | 0 |
| B | 0 | 1600 | 0 |
| C | 0 | 1600 | 0 |
| D | 0 | 1600 | 0 |
| Mode M9 | |||
|---|---|---|---|
| Quadrant | BADHDUFLAG | Total packets | Discarded packets |
| A | 0 | 134 | 0 |
| B | 0 | 134 | 0 |
| C | 0 | 134 | 0 |
| D | 0 | 134 | 0 |
| Mode M0 | |||
|---|---|---|---|
| Quadrant | BADHDUFLAG | Total packets | Discarded packets |
| A | 0 | 190112 | 0 |
| B | 0 | 174326 | 0 |
| C | 0 | 164503 | 0 |
| D | 0 | 265493 | 0 |
| Quadrant | Total seconds | Saturated seconds | Saturation percentage |
|---|---|---|---|
| A | 78329 | 3197 | 4.081502% |
| B | 78328 | 1308 | 1.669901% |
| C | 78328 | 1227 | 1.566490% |
| D | 78328 | 12818 | 16.364518% |
Noise dominated data is calculated using 1-second bins in cleaned event files. If a bin has >2000 counts, and if more than 50% of those come from <1% of pixels, then it is considered to be noise-dominated and hence unusable.
| Quadrant | # 1 sec bins | Bins with >0 counts | Bins with >2000 counts | High rate bins dominated by noise | Noise dominated (total time) | Noise dominated (detector-on time) | Marked lightcurve |
|---|---|---|---|---|---|---|---|
| A | 91754 | 78332 | 211 | 211 | 0.23% | 0.27% |  |
| B | 91754 | 78330 | 11 | 11 | 0.01% | 0.01% | 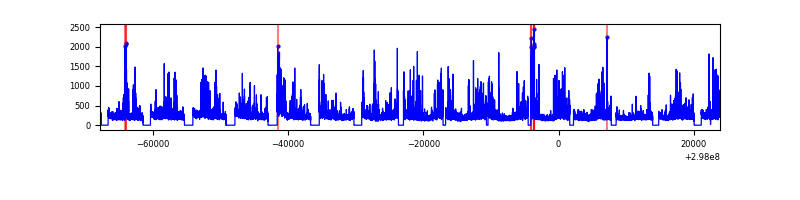 |
| C | 91754 | 78330 | 2 | 2 | 0.00% | 0.00% |  |
| D | 91754 | 78333 | 4376 | 4376 | 4.77% | 5.59% | 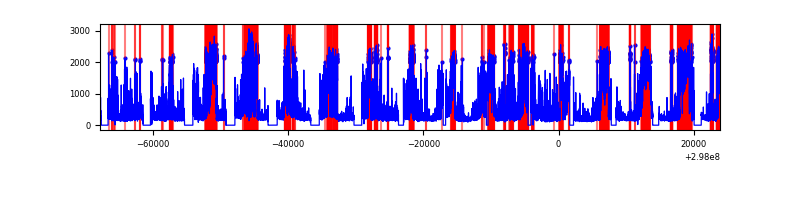 |
Top three noisy pixels from each quadrant. If the there are fewer than three noisy pixels in the level2.evt file, extra rows are filled as -1
| Pixel properties | Quadrant properties | ||||||
|---|---|---|---|---|---|---|---|
| Quadrant | DetID | PixID | Counts | Sigma | Mean | Median | Sigma |
| A | 14 | 238 | 5246632 | 5744.45 | 4188 | 4121 | 912.6 |
| A | 5 | 16 | 1060978 | 1158.04 | 4188 | 4121 | 912.6 |
| A | 14 | 254 | 909611 | 992.19 | 4188 | 4121 | 912.6 |
| B | 7 | 220 | 803597 | 1013.67 | 4216 | 4122 | 788.7 |
| B | 0 | 189 | 579258 | 729.22 | 4216 | 4122 | 788.7 |
| B | 0 | 197 | 454513 | 571.06 | 4216 | 4122 | 788.7 |
| C | 3 | 233 | 619893 | 638.22 | 4101 | 4095 | 964.9 |
| C | 0 | 207 | 219399 | 223.14 | 4101 | 4095 | 964.9 |
| C | 7 | 247 | 32103 | 29.03 | 4101 | 4095 | 964.9 |
| D | 7 | 38 | 19197959 | 20393.69 | 3971 | 3840 | 941.2 |
| D | 7 | 238 | 5342256 | 5672.05 | 3971 | 3840 | 941.2 |
| D | 1 | 52 | 2576816 | 2733.78 | 3971 | 3840 | 941.2 |
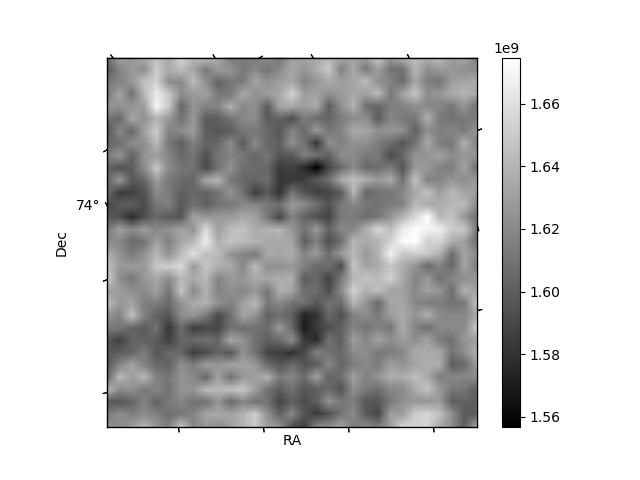
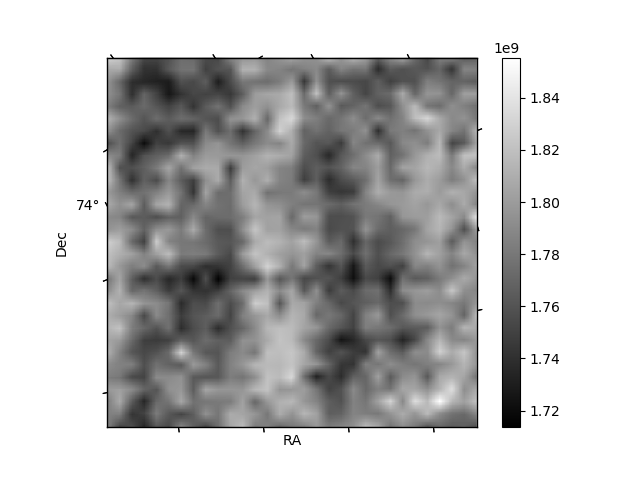
Histogram calculated using DETX and DETY for each event in the final _common_clean file
| Quadrant A |  |
 |
Quadrant B |
|---|---|---|---|
| Quadrant D | 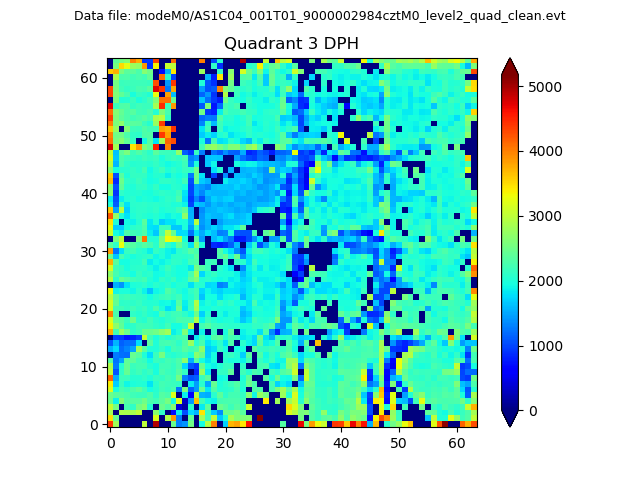 |
 |
Quadrant C |
| Plot type | Count rate plots | Images |
|---|---|---|
| Comparison with Poisson distribution Blue bars denote a histogram of data divided into 1 sec bins. Red curve is a Poisson curve with rate = median count rate of data. |
 |
 |
| Quadrant-wise count rates Data is divided into 100 sec bins |
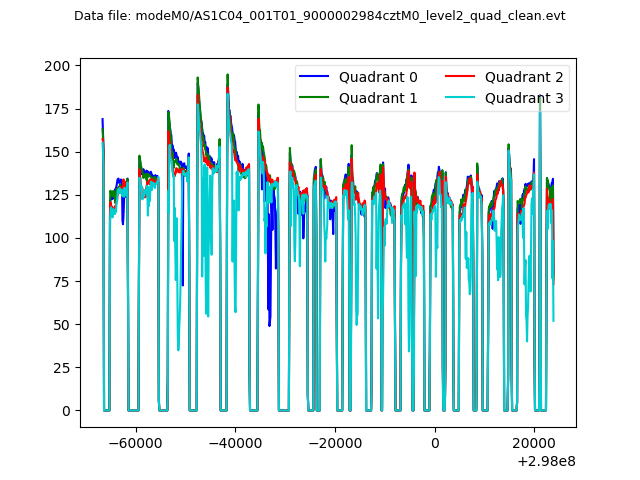 |
|
| Module-wise count rates for Quadrant A Data is divided into 100 sec bins |
 |
 |
| Module-wise count rates for Quadrant B Data is divided into 100 sec bins |
 |
 |
| Module-wise count rates for Quadrant C Data is divided into 100 sec bins |
 |
 |
| Module-wise count rates for Quadrant D Data is divided into 100 sec bins |
 |
 |
| Parameter | Plot |
|---|---|
| CZT HV Monitor |  |
| D_VDD |  |
| Temperature 1 |  |
| Veto HV Monitor | 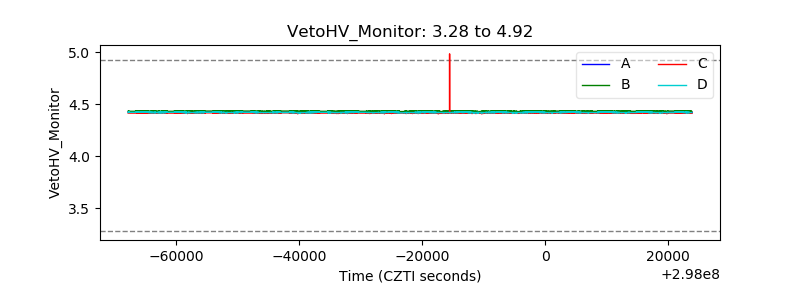 |
| Veto LLD | 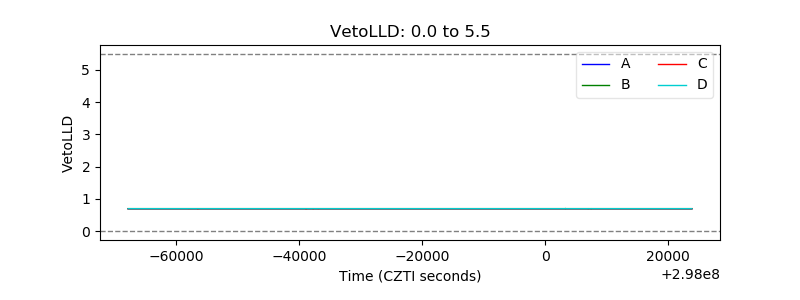 |
| Alpha Counter | 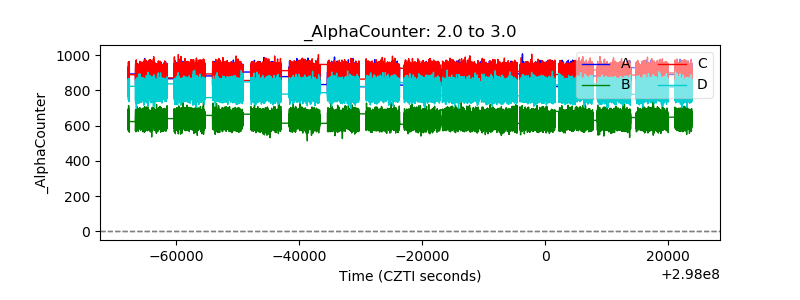 |
| _CPM_Rate | 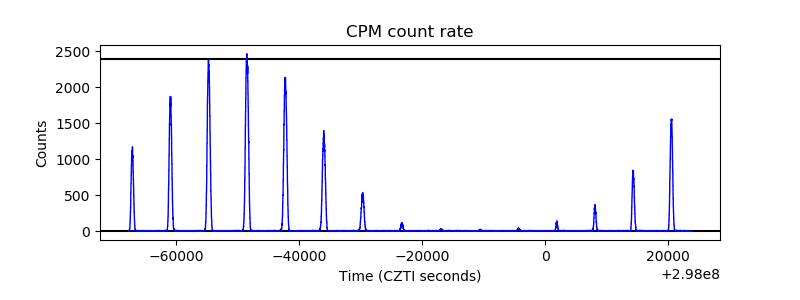 |
| CZT Counter | 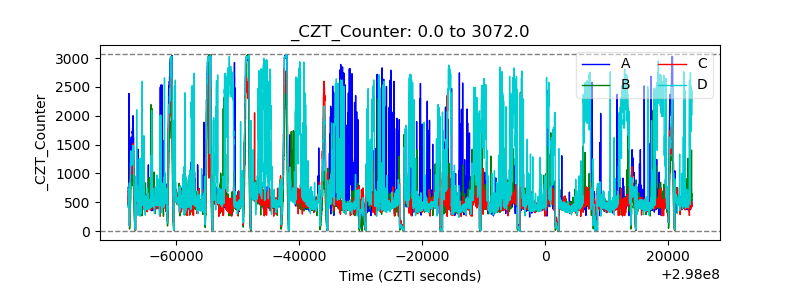 |
| +2.5 Volts monitor |  |
| +5 Volts monitor |  |
| _ROLL_ROT |  |
| _Roll_DEC |  |
| _Roll_RA |  |
| Veto Counter |  |