| Param | Original file | Final file |
|---|---|---|
| Filename | modeM0/AS1A06_002T02_9000002982cztM0_level2_bc.evt | modeM0/AS1A06_002T02_9000002982cztM0_level2_quad_clean.evt |
| Size (bytes) | 5,041,321,920 | 1,795,368,960 |
| Size | 4.7 GB | 1.7 GB |
| Events in quadrant A | 37,790,977 | 11,423,645 |
| Events in quadrant B | 32,300,716 | 11,614,117 |
| Events in quadrant C | 32,564,297 | 11,109,278 |
| Events in quadrant D | 40,849,748 | 11,005,113 |
| Mode M9 | |||
|---|---|---|---|
| Quadrant | BADHDUFLAG | Total packets | Discarded packets |
| A | 0 | 211 | 0 |
| B | 0 | 211 | 0 |
| C | 0 | 211 | 0 |
| D | 0 | 211 | 0 |
| Mode SS | |||
|---|---|---|---|
| Quadrant | BADHDUFLAG | Total packets | Discarded packets |
| A | 0 | 2744 | 0 |
| B | 0 | 2744 | 0 |
| C | 0 | 2744 | 0 |
| D | 0 | 2744 | 0 |
| Mode M0 | |||
|---|---|---|---|
| Quadrant | BADHDUFLAG | Total packets | Discarded packets |
| A | 0 | 320026 | 0 |
| B | 0 | 298611 | 0 |
| C | 0 | 301139 | 0 |
| D | 0 | 324382 | 0 |
| Quadrant | Total seconds | Saturated seconds | Saturation percentage |
|---|---|---|---|
| A | 134700 | 4565 | 3.389013% |
| B | 134700 | 2446 | 1.815887% |
| C | 134700 | 2967 | 2.202673% |
| D | 134700 | 4015 | 2.980698% |
Noise dominated data is calculated using 1-second bins in cleaned event files. If a bin has >2000 counts, and if more than 50% of those come from <1% of pixels, then it is considered to be noise-dominated and hence unusable.
| Quadrant | # 1 sec bins | Bins with >0 counts | Bins with >2000 counts | High rate bins dominated by noise | Noise dominated (total time) | Noise dominated (detector-on time) | Marked lightcurve |
|---|---|---|---|---|---|---|---|
| A | 154904 | 134693 | 97 | 97 | 0.06% | 0.07% | 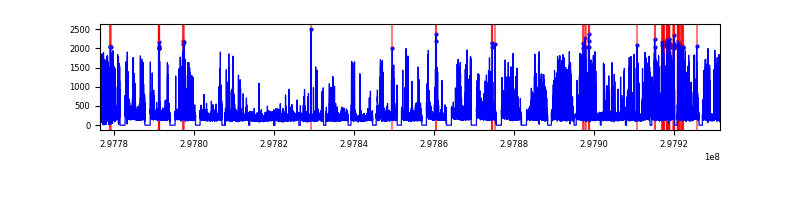 |
| B | 154903 | 134691 | 45 | 45 | 0.03% | 0.03% |  |
| C | 154904 | 134696 | 5 | 5 | 0.00% | 0.00% |  |
| D | 154903 | 134696 | 477 | 477 | 0.31% | 0.35% |  |
Top three noisy pixels from each quadrant. If the there are fewer than three noisy pixels in the level2.evt file, extra rows are filled as -1
| Pixel properties | Quadrant properties | ||||||
|---|---|---|---|---|---|---|---|
| Quadrant | DetID | PixID | Counts | Sigma | Mean | Median | Sigma |
| A | 14 | 238 | 7667701 | 4796.55 | 7346 | 7223 | 1597.1 |
| A | 14 | 254 | 1059240 | 658.71 | 7346 | 7223 | 1597.1 |
| A | 5 | 16 | 429663 | 264.51 | 7346 | 7223 | 1597.1 |
| B | 7 | 220 | 1290756 | 919.21 | 7421 | 7241 | 1396.3 |
| B | 0 | 197 | 535982 | 378.67 | 7421 | 7241 | 1396.3 |
| B | 0 | 245 | 285949 | 199.6 | 7421 | 7241 | 1396.3 |
| C | 3 | 233 | 2267164 | 1372.24 | 7078 | 7056 | 1647.0 |
| C | 0 | 207 | 1621795 | 980.4 | 7078 | 7056 | 1647.0 |
| C | 9 | 221 | 1344842 | 812.24 | 7078 | 7056 | 1647.0 |
| D | 1 | 52 | 5833874 | 3528.24 | 7263 | 7038 | 1651.5 |
| D | 12 | 218 | 2402390 | 1450.42 | 7263 | 7038 | 1651.5 |
| D | 7 | 238 | 1210693 | 728.83 | 7263 | 7038 | 1651.5 |
Histogram calculated using DETX and DETY for each event in the final _common_clean file
| Quadrant A |  |
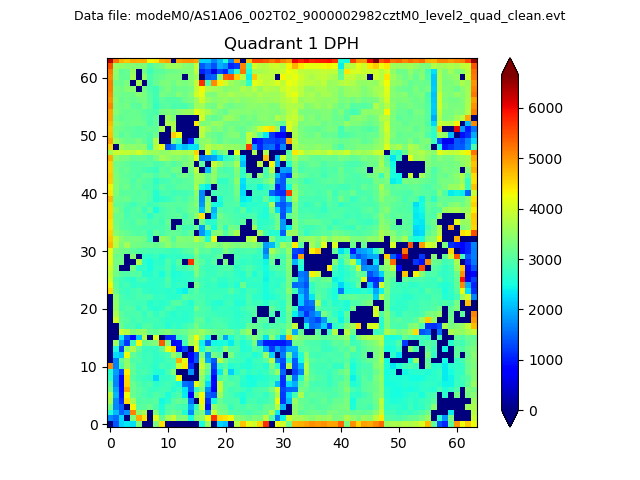 |
Quadrant B |
|---|---|---|---|
| Quadrant D |  |
 |
Quadrant C |
| Plot type | Count rate plots | Images |
|---|---|---|
| Comparison with Poisson distribution Blue bars denote a histogram of data divided into 1 sec bins. Red curve is a Poisson curve with rate = median count rate of data. |
 |
 |
| Quadrant-wise count rates Data is divided into 100 sec bins |
 |
|
| Module-wise count rates for Quadrant A Data is divided into 100 sec bins |
 |
 |
| Module-wise count rates for Quadrant B Data is divided into 100 sec bins |
 |
 |
| Module-wise count rates for Quadrant C Data is divided into 100 sec bins |
 |
 |
| Module-wise count rates for Quadrant D Data is divided into 100 sec bins |
 |
 |
| Parameter | Plot |
|---|---|
| CZT HV Monitor |  |
| D_VDD |  |
| Temperature 1 | 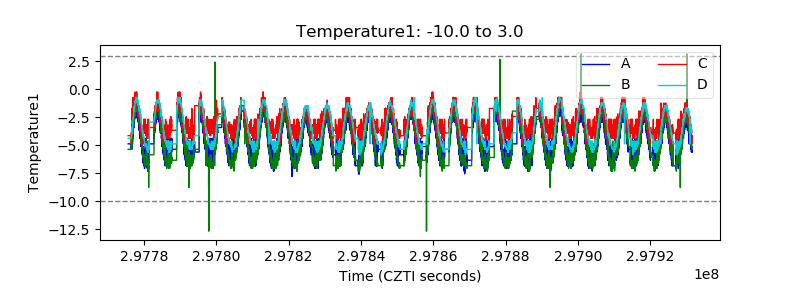 |
| Veto HV Monitor | 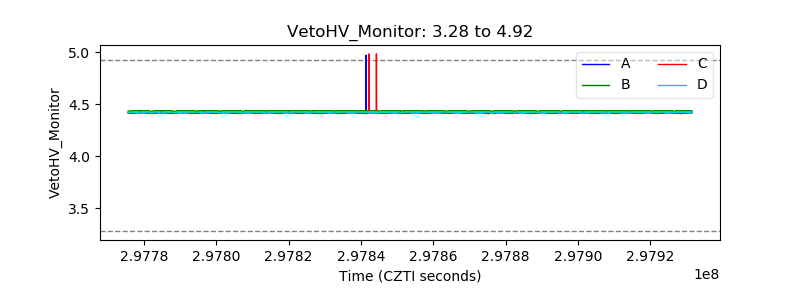 |
| Veto LLD |  |
| Alpha Counter |  |
| _CPM_Rate |  |
| CZT Counter |  |
| +2.5 Volts monitor |  |
| +5 Volts monitor |  |
| _ROLL_ROT |  |
| _Roll_DEC |  |
| _Roll_RA | 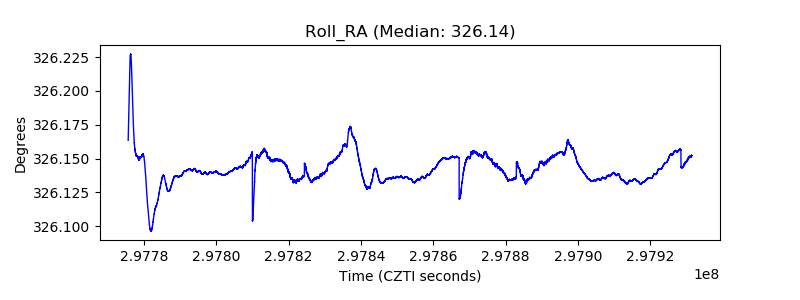 |
| Veto Counter | 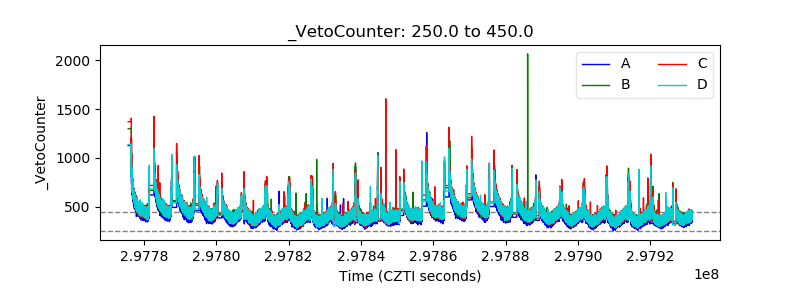 |