| Param | Original file | Final file |
|---|---|---|
| Filename | modeM0/AS1C04_005T01_9000002976cztM0_level2_bc.evt | modeM0/AS1C04_005T01_9000002976cztM0_level2_quad_clean.evt |
| Size (bytes) | 2,595,467,520 | 485,593,920 |
| Size | 2.4 GB | 463.1 MB |
| Events in quadrant A | 36,328,108 | 1,630,886 |
| Events in quadrant B | 10,332,487 | 3,508,649 |
| Events in quadrant C | 11,149,925 | 3,327,316 |
| Events in quadrant D | 17,850,757 | 3,282,713 |
| Mode M0 | |||
|---|---|---|---|
| Quadrant | BADHDUFLAG | Total packets | Discarded packets |
| A | 0 | 288274 | 0 |
| B | 0 | 93942 | 0 |
| C | 0 | 99103 | 0 |
| D | 0 | 115837 | 0 |
| Mode SS | |||
|---|---|---|---|
| Quadrant | BADHDUFLAG | Total packets | Discarded packets |
| A | 0 | 874 | 0 |
| B | 0 | 874 | 0 |
| C | 0 | 874 | 0 |
| D | 0 | 874 | 0 |
| Mode M9 | |||
|---|---|---|---|
| Quadrant | BADHDUFLAG | Total packets | Discarded packets |
| A | 0 | 92 | 0 |
| B | 0 | 92 | 0 |
| C | 0 | 92 | 0 |
| D | 0 | 92 | 0 |
| Quadrant | Total seconds | Saturated seconds | Saturation percentage |
|---|---|---|---|
| A | 42965 | 32354 | 75.303154% |
| B | 42965 | 565 | 1.315024% |
| C | 42965 | 952 | 2.215757% |
| D | 42965 | 2800 | 6.516932% |
Noise dominated data is calculated using 1-second bins in cleaned event files. If a bin has >2000 counts, and if more than 50% of those come from <1% of pixels, then it is considered to be noise-dominated and hence unusable.
| Quadrant | # 1 sec bins | Bins with >0 counts | Bins with >2000 counts | High rate bins dominated by noise | Noise dominated (total time) | Noise dominated (detector-on time) | Marked lightcurve |
|---|---|---|---|---|---|---|---|
| A | 52079 | 42098 | 731 | 731 | 1.40% | 1.74% | 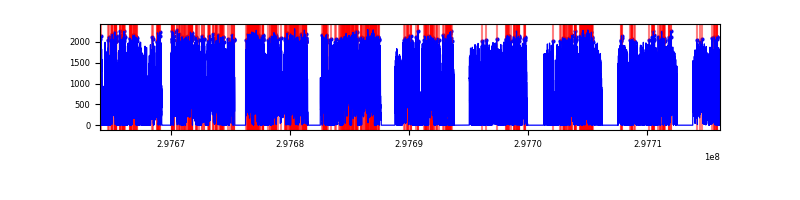 |
| B | 52080 | 42958 | 2 | 2 | 0.00% | 0.00% |  |
| C | 52080 | 42959 | 1 | 1 | 0.00% | 0.00% |  |
| D | 52080 | 42958 | 1882 | 1882 | 3.61% | 4.38% |  |
Top three noisy pixels from each quadrant. If the there are fewer than three noisy pixels in the level2.evt file, extra rows are filled as -1
| Pixel properties | Quadrant properties | ||||||
|---|---|---|---|---|---|---|---|
| Quadrant | DetID | PixID | Counts | Sigma | Mean | Median | Sigma |
| A | 14 | 238 | 31913165 | 131049.02 | 1124 | 1106 | 243.5 |
| A | 14 | 254 | 36090 | 143.66 | 1124 | 1106 | 243.5 |
| A | 11 | 29 | 21332 | 83.06 | 1124 | 1106 | 243.5 |
| B | 7 | 220 | 402479 | 870.44 | 2482 | 2425 | 459.6 |
| B | 4 | 171 | 84339 | 178.23 | 2482 | 2425 | 459.6 |
| B | 0 | 230 | 73424 | 154.48 | 2482 | 2425 | 459.6 |
| C | 9 | 221 | 1208693 | 2225.99 | 2352 | 2348 | 541.9 |
| C | 3 | 233 | 736531 | 1354.74 | 2352 | 2348 | 541.9 |
| C | 0 | 207 | 162932 | 296.31 | 2352 | 2348 | 541.9 |
| D | 7 | 238 | 6213466 | 11392.18 | 2397 | 2320 | 545.2 |
| D | 1 | 52 | 1853090 | 3394.59 | 2397 | 2320 | 545.2 |
| D | 12 | 218 | 222167 | 403.23 | 2397 | 2320 | 545.2 |
Histogram calculated using DETX and DETY for each event in the final _common_clean file
| Quadrant A |  |
 |
Quadrant B |
|---|---|---|---|
| Quadrant D |  |
 |
Quadrant C |
| Plot type | Count rate plots | Images |
|---|---|---|
| Comparison with Poisson distribution Blue bars denote a histogram of data divided into 1 sec bins. Red curve is a Poisson curve with rate = median count rate of data. |
 |
 |
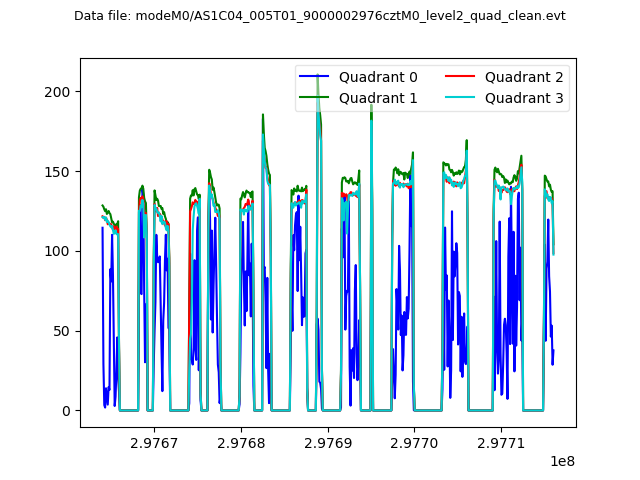
| Quadrant-wise count rates Data is divided into 100 sec bins |
 |
|
| Module-wise count rates for Quadrant A Data is divided into 100 sec bins |
 |
 |
| Module-wise count rates for Quadrant B Data is divided into 100 sec bins |
 |
 |
| Module-wise count rates for Quadrant C Data is divided into 100 sec bins |
 |
 |
| Module-wise count rates for Quadrant D Data is divided into 100 sec bins |
 |
 |
| Parameter | Plot |
|---|---|
| CZT HV Monitor |  |
| D_VDD |  |
| Temperature 1 |  |
| Veto HV Monitor |  |
| Veto LLD |  |
| Alpha Counter |  |
| _CPM_Rate |  |
| CZT Counter |  |
| +2.5 Volts monitor |  |
| +5 Volts monitor |  |
| _ROLL_ROT |  |
| _Roll_DEC | 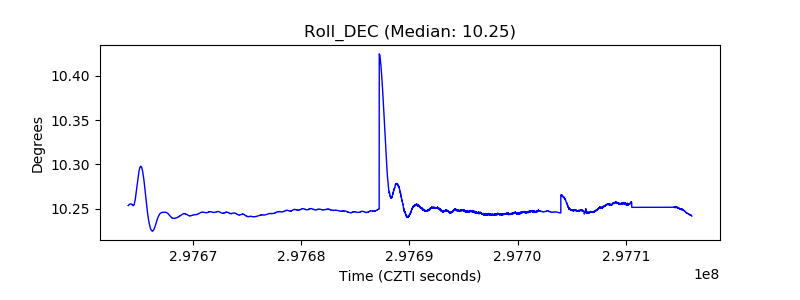 |
| _Roll_RA |  |
| Veto Counter |  |