| Param | Original file | Final file |
|---|---|---|
| Filename | modeM0/AS1A05_082T09_9000002978cztM0_level2_bc.evt | modeM0/AS1A05_082T09_9000002978cztM0_level2_quad_clean.evt |
| Size (bytes) | 1,617,592,320 | 396,429,120 |
| Size | 1.5 GB | 378.1 MB |
| Events in quadrant A | 20,285,509 | 1,153,746 |
| Events in quadrant B | 7,611,923 | 2,904,155 |
| Events in quadrant C | 9,260,919 | 2,744,827 |
| Events in quadrant D | 9,370,113 | 2,737,090 |
| Mode SS | |||
|---|---|---|---|
| Quadrant | BADHDUFLAG | Total packets | Discarded packets |
| A | 0 | 724 | 0 |
| B | 0 | 724 | 0 |
| C | 0 | 724 | 0 |
| D | 0 | 724 | 0 |
| Mode M0 | |||
|---|---|---|---|
| Quadrant | BADHDUFLAG | Total packets | Discarded packets |
| A | 0 | 218234 | 0 |
| B | 0 | 75022 | 0 |
| C | 0 | 81448 | 0 |
| D | 0 | 80273 | 0 |
| Mode M9 | |||
|---|---|---|---|
| Quadrant | BADHDUFLAG | Total packets | Discarded packets |
| A | 0 | 35 | 0 |
| B | 0 | 35 | 0 |
| C | 0 | 35 | 0 |
| D | 0 | 35 | 0 |
| Quadrant | Total seconds | Saturated seconds | Saturation percentage |
|---|---|---|---|
| A | 35819 | 24693 | 68.938273% |
| B | 35819 | 396 | 1.105559% |
| C | 35819 | 645 | 1.800720% |
| D | 35819 | 456 | 1.273067% |
Noise dominated data is calculated using 1-second bins in cleaned event files. If a bin has >2000 counts, and if more than 50% of those come from <1% of pixels, then it is considered to be noise-dominated and hence unusable.
| Quadrant | # 1 sec bins | Bins with >0 counts | Bins with >2000 counts | High rate bins dominated by noise | Noise dominated (total time) | Noise dominated (detector-on time) | Marked lightcurve |
|---|---|---|---|---|---|---|---|
| A | 39128 | 34886 | 185 | 185 | 0.47% | 0.53% |  |
| B | 39129 | 35814 | 6 | 6 | 0.02% | 0.02% |  |
| C | 39129 | 35816 | 5 | 5 | 0.01% | 0.01% | 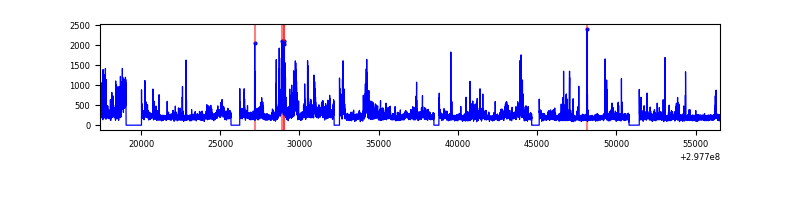 |
| D | 39129 | 35815 | 123 | 123 | 0.31% | 0.34% |  |
Top three noisy pixels from each quadrant. If the there are fewer than three noisy pixels in the level2.evt file, extra rows are filled as -1
| Pixel properties | Quadrant properties | ||||||
|---|---|---|---|---|---|---|---|
| Quadrant | DetID | PixID | Counts | Sigma | Mean | Median | Sigma |
| A | 14 | 238 | 16631884 | 87029.59 | 845 | 827 | 191.1 |
| A | 14 | 254 | 278037 | 1450.63 | 845 | 827 | 191.1 |
| A | 14 | 237 | 76002 | 393.39 | 845 | 827 | 191.1 |
| B | 7 | 220 | 88307 | 236.6 | 1883 | 1829 | 365.5 |
| B | 3 | 64 | 69520 | 185.2 | 1883 | 1829 | 365.5 |
| B | 4 | 171 | 56560 | 149.74 | 1883 | 1829 | 365.5 |
| C | 3 | 233 | 1680268 | 3944.7 | 1788 | 1777 | 425.5 |
| C | 9 | 221 | 560203 | 1312.38 | 1788 | 1777 | 425.5 |
| C | 0 | 207 | 99893 | 230.59 | 1788 | 1777 | 425.5 |
| D | 1 | 52 | 1764559 | 3960.11 | 1863 | 1794 | 445.1 |
| D | 12 | 218 | 242393 | 540.51 | 1863 | 1794 | 445.1 |
| D | 2 | 234 | 142886 | 316.97 | 1863 | 1794 | 445.1 |
Histogram calculated using DETX and DETY for each event in the final _common_clean file
| Quadrant A |  |
 |
Quadrant B |
|---|---|---|---|
| Quadrant D |  |
 |
Quadrant C |
| Plot type | Count rate plots | Images |
|---|---|---|
| Comparison with Poisson distribution Blue bars denote a histogram of data divided into 1 sec bins. Red curve is a Poisson curve with rate = median count rate of data. |
 |
 |
| Quadrant-wise count rates Data is divided into 100 sec bins |
 |
|
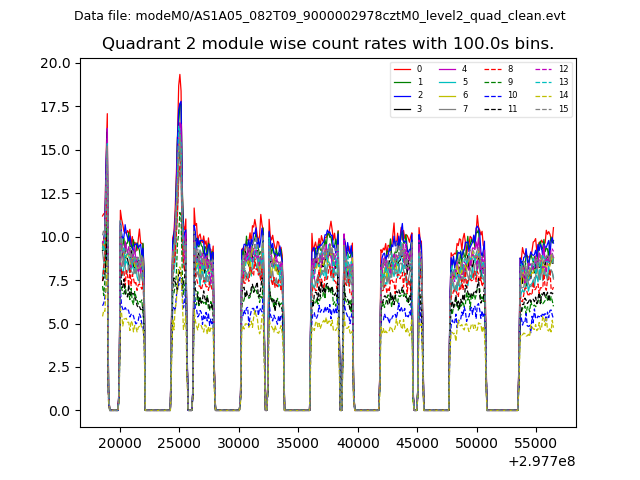
| Module-wise count rates for Quadrant A Data is divided into 100 sec bins |
 |
 |
| Module-wise count rates for Quadrant B Data is divided into 100 sec bins |
 |
 |
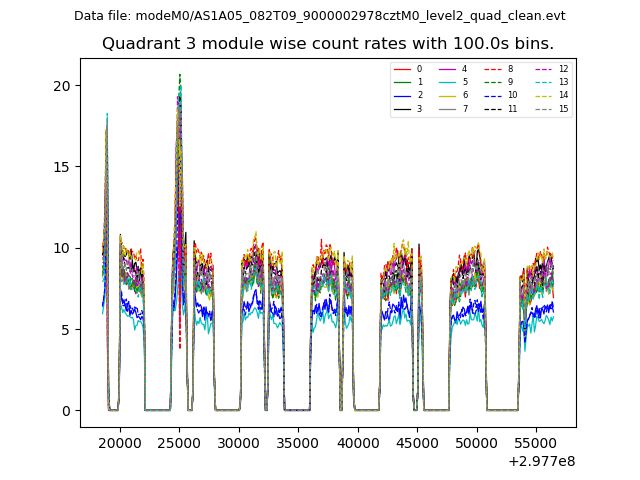
| Module-wise count rates for Quadrant C Data is divided into 100 sec bins |
 |
 |
| Module-wise count rates for Quadrant D Data is divided into 100 sec bins |
 |
 |
| Parameter | Plot |
|---|---|
| CZT HV Monitor |  |
| D_VDD |  |
| Temperature 1 |  |
| Veto HV Monitor |  |
| Veto LLD |  |
| Alpha Counter |  |
| _CPM_Rate |  |
| CZT Counter |  |
| +2.5 Volts monitor |  |
| +5 Volts monitor |  |
| _ROLL_ROT | 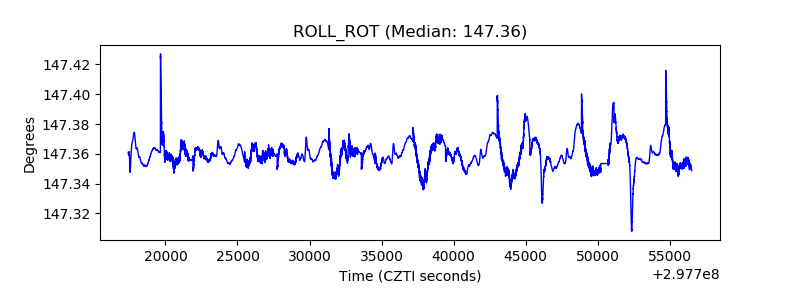 |
| _Roll_DEC |  |
| _Roll_RA |  |
| Veto Counter |  |