| Param | Original file | Final file |
|---|---|---|
| Filename | modeM0/AS1A05_103T05_9000002974cztM0_level2_bc.evt | modeM0/AS1A05_103T05_9000002974cztM0_level2_quad_clean.evt |
| Size (bytes) | 1,311,160,320 | 410,221,440 |
| Size | 1.2 GB | 391.2 MB |
| Events in quadrant A | 13,797,314 | 2,153,907 |
| Events in quadrant B | 6,999,654 | 2,835,930 |
| Events in quadrant C | 8,176,341 | 2,691,146 |
| Events in quadrant D | 8,585,068 | 2,582,157 |
| Mode SS | |||
|---|---|---|---|
| Quadrant | BADHDUFLAG | Total packets | Discarded packets |
| A | 0 | 638 | 0 |
| B | 0 | 638 | 0 |
| C | 0 | 638 | 0 |
| D | 0 | 638 | 0 |
| Mode M0 | |||
|---|---|---|---|
| Quadrant | BADHDUFLAG | Total packets | Discarded packets |
| A | 0 | 122827 | 0 |
| B | 0 | 66923 | 0 |
| C | 0 | 70897 | 0 |
| D | 0 | 72180 | 0 |
| Mode M9 | |||
|---|---|---|---|
| Quadrant | BADHDUFLAG | Total packets | Discarded packets |
| A | 0 | 31 | 0 |
| B | 0 | 31 | 0 |
| C | 0 | 31 | 0 |
| D | 0 | 31 | 0 |
| Quadrant | Total seconds | Saturated seconds | Saturation percentage |
|---|---|---|---|
| A | 31410 | 9401 | 29.929959% |
| B | 31410 | 349 | 1.111111% |
| C | 31410 | 519 | 1.652340% |
| D | 31410 | 1039 | 3.307864% |
Noise dominated data is calculated using 1-second bins in cleaned event files. If a bin has >2000 counts, and if more than 50% of those come from <1% of pixels, then it is considered to be noise-dominated and hence unusable.
| Quadrant | # 1 sec bins | Bins with >0 counts | Bins with >2000 counts | High rate bins dominated by noise | Noise dominated (total time) | Noise dominated (detector-on time) | Marked lightcurve |
|---|---|---|---|---|---|---|---|
| A | 34449 | 31270 | 29 | 29 | 0.08% | 0.09% |  |
| B | 34450 | 31407 | 4 | 4 | 0.01% | 0.01% |  |
| C | 34450 | 31407 | 9 | 9 | 0.03% | 0.03% |  |
| D | 34450 | 31407 | 409 | 409 | 1.19% | 1.30% | 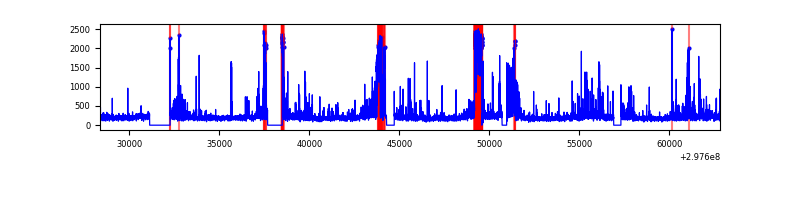 |
Top three noisy pixels from each quadrant. If the there are fewer than three noisy pixels in the level2.evt file, extra rows are filled as -1
| Pixel properties | Quadrant properties | ||||||
|---|---|---|---|---|---|---|---|
| Quadrant | DetID | PixID | Counts | Sigma | Mean | Median | Sigma |
| A | 14 | 238 | 8748604 | 30868.97 | 1285 | 1260 | 283.4 |
| A | 14 | 254 | 60516 | 209.11 | 1285 | 1260 | 283.4 |
| A | 11 | 29 | 27334 | 92.01 | 1285 | 1260 | 283.4 |
| B | 7 | 220 | 309644 | 981.1 | 1623 | 1581 | 314.0 |
| B | 0 | 197 | 101109 | 316.97 | 1623 | 1581 | 314.0 |
| B | 0 | 190 | 56940 | 176.3 | 1623 | 1581 | 314.0 |
| C | 3 | 233 | 906444 | 2434.37 | 1548 | 1537 | 371.7 |
| C | 9 | 221 | 790787 | 2123.23 | 1548 | 1537 | 371.7 |
| C | 10 | 222 | 354679 | 950.02 | 1548 | 1537 | 371.7 |
| D | 7 | 238 | 942879 | 2588.85 | 1556 | 1504 | 363.6 |
| D | 1 | 20 | 812399 | 2230.02 | 1556 | 1504 | 363.6 |
| D | 12 | 218 | 344691 | 943.79 | 1556 | 1504 | 363.6 |
Histogram calculated using DETX and DETY for each event in the final _common_clean file
| Quadrant A |  |
 |
Quadrant B |
|---|---|---|---|
| Quadrant D |  |
 |
Quadrant C |
| Plot type | Count rate plots | Images |
|---|---|---|
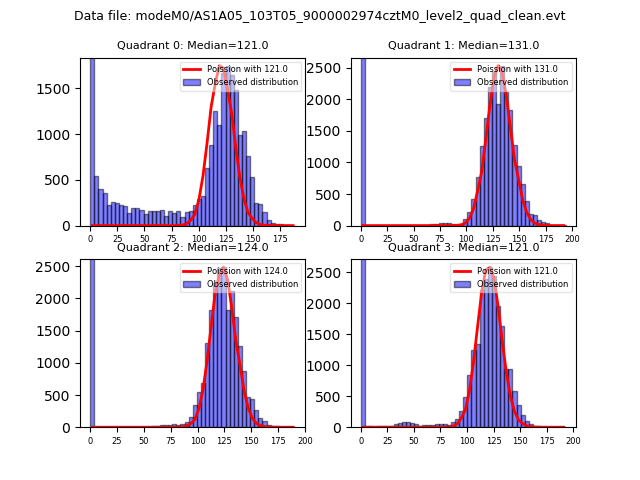
| Comparison with Poisson distribution Blue bars denote a histogram of data divided into 1 sec bins. Red curve is a Poisson curve with rate = median count rate of data. |
 |
 |
| Quadrant-wise count rates Data is divided into 100 sec bins |
 |
|
| Module-wise count rates for Quadrant A Data is divided into 100 sec bins |
 |
 |
| Module-wise count rates for Quadrant B Data is divided into 100 sec bins |
 |
 |
| Module-wise count rates for Quadrant C Data is divided into 100 sec bins |
 |
 |
| Module-wise count rates for Quadrant D Data is divided into 100 sec bins |
 |
 |
| Parameter | Plot |
|---|---|
| CZT HV Monitor | 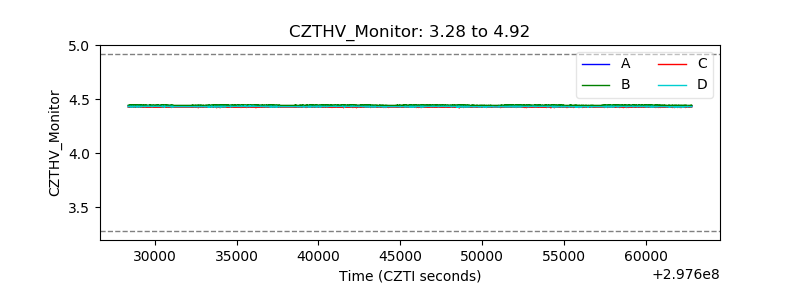 |
| D_VDD |  |
| Temperature 1 |  |
| Veto HV Monitor |  |
| Veto LLD |  |
| Alpha Counter |  |
| _CPM_Rate |  |
| CZT Counter |  |
| +2.5 Volts monitor |  |
| +5 Volts monitor |  |
| _ROLL_ROT |  |
| _Roll_DEC |  |
| _Roll_RA | 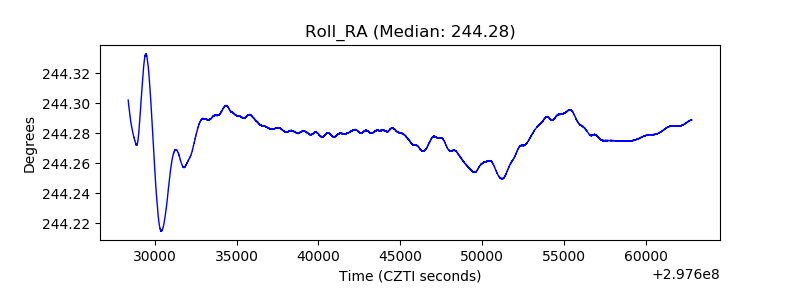 |
| Veto Counter |  |