| Param | Original file | Final file |
|---|---|---|
| Filename | modeM0/AS1C04_009T05_9000002968cztM0_level2_bc.evt | modeM0/AS1C04_009T05_9000002968cztM0_level2_quad_clean.evt |
| Size (bytes) | 276,448,320 | 119,738,880 |
| Size | 263.6 MB | 114.2 MB |
| Events in quadrant A | 1,286,853 | 827,929 |
| Events in quadrant B | 1,576,182 | 821,925 |
| Events in quadrant C | 2,974,733 | 777,429 |
| Events in quadrant D | 2,132,153 | 793,585 |
| Mode SS | |||
|---|---|---|---|
| Quadrant | BADHDUFLAG | Total packets | Discarded packets |
| A | 0 | 118 | 0 |
| B | 0 | 118 | 0 |
| C | 0 | 118 | 0 |
| D | 0 | 118 | 0 |
| Mode M0 | |||
|---|---|---|---|
| Quadrant | BADHDUFLAG | Total packets | Discarded packets |
| A | 0 | 12141 | 0 |
| B | 0 | 13200 | 0 |
| C | 0 | 19611 | 0 |
| D | 0 | 14655 | 0 |
| Mode M9 | |||
|---|---|---|---|
| Quadrant | BADHDUFLAG | Total packets | Discarded packets |
| A | 0 | 12 | 0 |
| B | 0 | 12 | 0 |
| C | 0 | 12 | 0 |
| D | 0 | 12 | 0 |
| Quadrant | Total seconds | Saturated seconds | Saturation percentage |
|---|---|---|---|
| A | 5803 | 55 | 0.947786% |
| B | 5803 | 72 | 1.240738% |
| C | 5803 | 498 | 8.581768% |
| D | 5803 | 128 | 2.205756% |
Noise dominated data is calculated using 1-second bins in cleaned event files. If a bin has >2000 counts, and if more than 50% of those come from <1% of pixels, then it is considered to be noise-dominated and hence unusable.
| Quadrant | # 1 sec bins | Bins with >0 counts | Bins with >2000 counts | High rate bins dominated by noise | Noise dominated (total time) | Noise dominated (detector-on time) | Marked lightcurve |
|---|---|---|---|---|---|---|---|
| A | 6998 | 5802 | 0 | 0 | 0.00% | 0.00% |  |
| B | 6998 | 5802 | 1 | 1 | 0.01% | 0.02% |  |
| C | 6998 | 5802 | 2 | 2 | 0.03% | 0.03% |  |
| D | 6998 | 5802 | 59 | 59 | 0.84% | 1.02% |  |
Top three noisy pixels from each quadrant. If the there are fewer than three noisy pixels in the level2.evt file, extra rows are filled as -1
| Pixel properties | Quadrant properties | ||||||
|---|---|---|---|---|---|---|---|
| Quadrant | DetID | PixID | Counts | Sigma | Mean | Median | Sigma |
| A | 8 | 205 | 4625 | 57.93 | 333 | 327 | 74.2 |
| A | 0 | 226 | 2346 | 27.21 | 333 | 327 | 74.2 |
| A | 12 | 194 | 2271 | 26.2 | 333 | 327 | 74.2 |
| B | 0 | 189 | 90213 | 1425.86 | 330 | 324 | 63.0 |
| B | 0 | 197 | 36547 | 574.59 | 330 | 324 | 63.0 |
| B | 3 | 112 | 33574 | 527.43 | 330 | 324 | 63.0 |
| C | 3 | 233 | 1052979 | 13813.58 | 313 | 311 | 76.2 |
| C | 9 | 221 | 396200 | 5195.03 | 313 | 311 | 76.2 |
| C | 4 | 254 | 305943 | 4010.64 | 313 | 311 | 76.2 |
| D | 1 | 52 | 340057 | 4284.25 | 331 | 320 | 79.3 |
| D | 7 | 38 | 193271 | 2433.21 | 331 | 320 | 79.3 |
| D | 15 | 0 | 158041 | 1988.94 | 331 | 320 | 79.3 |
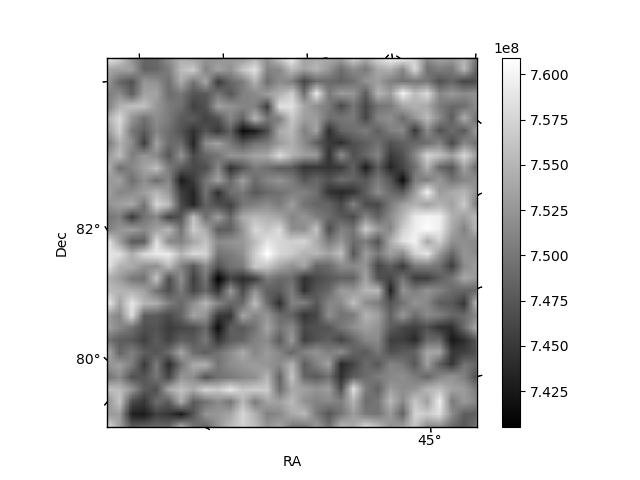
Histogram calculated using DETX and DETY for each event in the final _common_clean file
| Quadrant A |  |
 |
Quadrant B |
|---|---|---|---|
| Quadrant D |  |
 |
Quadrant C |
| Plot type | Count rate plots | Images |
|---|---|---|
| Comparison with Poisson distribution Blue bars denote a histogram of data divided into 1 sec bins. Red curve is a Poisson curve with rate = median count rate of data. |
 |
 |
| Quadrant-wise count rates Data is divided into 100 sec bins |
 |
|
| Module-wise count rates for Quadrant A Data is divided into 100 sec bins |
 |
 |
| Module-wise count rates for Quadrant B Data is divided into 100 sec bins |
 |
 |
| Module-wise count rates for Quadrant C Data is divided into 100 sec bins |
 |
 |
| Module-wise count rates for Quadrant D Data is divided into 100 sec bins |
 |
 |
| Parameter | Plot |
|---|---|
| CZT HV Monitor |  |
| D_VDD |  |
| Temperature 1 |  |
| Veto HV Monitor |  |
| Veto LLD |  |
| Alpha Counter |  |
| _CPM_Rate |  |
| CZT Counter |  |
| +2.5 Volts monitor |  |
| +5 Volts monitor | 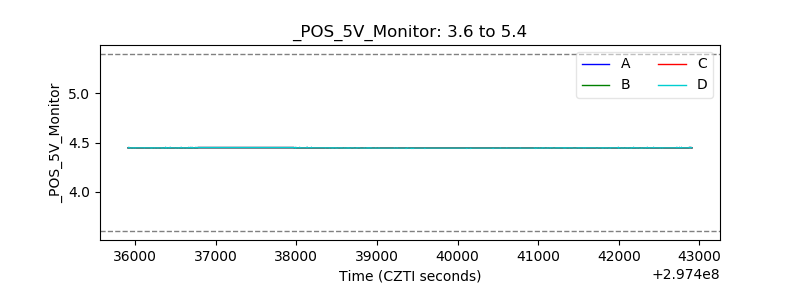 |
| _ROLL_ROT |  |
| _Roll_DEC |  |
| _Roll_RA |  |
| Veto Counter |  |