| Param | Original file | Final file |
|---|---|---|
| Filename | modeM0/AS1A05_227T01_9000002966cztM0_level2_bc.evt | modeM0/AS1A05_227T01_9000002966cztM0_level2_quad_clean.evt |
| Size (bytes) | 504,149,760 | 126,357,120 |
| Size | 480.8 MB | 120.5 MB |
| Events in quadrant A | 2,011,605 | 824,229 |
| Events in quadrant B | 2,515,778 | 816,117 |
| Events in quadrant C | 4,805,531 | 751,691 |
| Events in quadrant D | 5,275,515 | 768,847 |
| Mode SS | |||
|---|---|---|---|
| Quadrant | BADHDUFLAG | Total packets | Discarded packets |
| A | 0 | 196 | 0 |
| B | 0 | 196 | 0 |
| C | 0 | 196 | 0 |
| D | 0 | 196 | 0 |
| Mode M0 | |||
|---|---|---|---|
| Quadrant | BADHDUFLAG | Total packets | Discarded packets |
| A | 0 | 19676 | 0 |
| B | 0 | 21200 | 0 |
| C | 0 | 33034 | 0 |
| D | 0 | 30457 | 0 |
| Mode M9 | |||
|---|---|---|---|
| Quadrant | BADHDUFLAG | Total packets | Discarded packets |
| A | 0 | 20 | 0 |
| B | 0 | 20 | 0 |
| C | 0 | 20 | 0 |
| D | 0 | 20 | 0 |
| Quadrant | Total seconds | Saturated seconds | Saturation percentage |
|---|---|---|---|
| A | 9601 | 108 | 1.124883% |
| B | 9601 | 128 | 1.333194% |
| C | 9601 | 874 | 9.103218% |
| D | 9601 | 779 | 8.113738% |
Noise dominated data is calculated using 1-second bins in cleaned event files. If a bin has >2000 counts, and if more than 50% of those come from <1% of pixels, then it is considered to be noise-dominated and hence unusable.
| Quadrant | # 1 sec bins | Bins with >0 counts | Bins with >2000 counts | High rate bins dominated by noise | Noise dominated (total time) | Noise dominated (detector-on time) | Marked lightcurve |
|---|---|---|---|---|---|---|---|
| A | 11601 | 9599 | 0 | 0 | 0.00% | 0.00% | 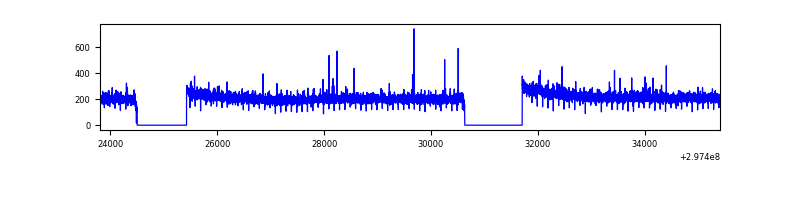 |
| B | 11601 | 9599 | 1 | 1 | 0.01% | 0.01% | 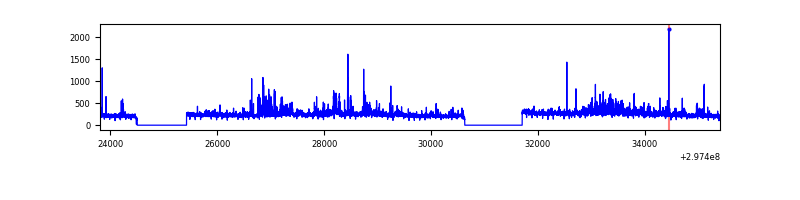 |
| C | 11601 | 9599 | 10 | 10 | 0.09% | 0.10% |  |
| D | 11601 | 9599 | 266 | 266 | 2.29% | 2.77% |  |
Top three noisy pixels from each quadrant. If the there are fewer than three noisy pixels in the level2.evt file, extra rows are filled as -1
| Pixel properties | Quadrant properties | ||||||
|---|---|---|---|---|---|---|---|
| Quadrant | DetID | PixID | Counts | Sigma | Mean | Median | Sigma |
| A | 9 | 143 | 4209 | 31.83 | 522 | 511 | 116.2 |
| A | 0 | 226 | 3521 | 25.91 | 522 | 511 | 116.2 |
| A | 12 | 194 | 3450 | 25.3 | 522 | 511 | 116.2 |
| B | 0 | 189 | 133684 | 1345.52 | 516 | 503 | 99.0 |
| B | 3 | 112 | 114903 | 1155.78 | 516 | 503 | 99.0 |
| B | 0 | 197 | 82509 | 828.5 | 516 | 503 | 99.0 |
| C | 9 | 221 | 1290391 | 11358.42 | 474 | 470 | 113.6 |
| C | 3 | 233 | 1051946 | 9258.79 | 474 | 470 | 113.6 |
| C | 4 | 254 | 597298 | 5255.38 | 474 | 470 | 113.6 |
| D | 7 | 38 | 2484228 | 21023.68 | 498 | 481 | 118.1 |
| D | 1 | 52 | 435712 | 3684.01 | 498 | 481 | 118.1 |
| D | 12 | 32 | 120454 | 1015.51 | 498 | 481 | 118.1 |
Histogram calculated using DETX and DETY for each event in the final _common_clean file
| Quadrant A |  |
 |
Quadrant B |
|---|---|---|---|
| Quadrant D | 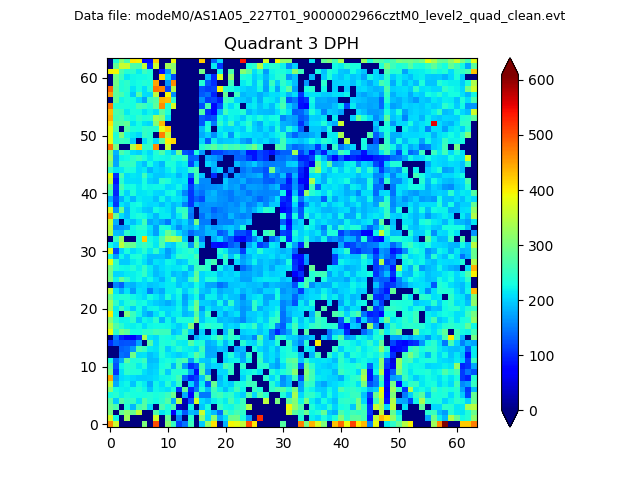 |
 |
Quadrant C |
| Plot type | Count rate plots | Images |
|---|---|---|
| Comparison with Poisson distribution Blue bars denote a histogram of data divided into 1 sec bins. Red curve is a Poisson curve with rate = median count rate of data. |
 |
 |
| Quadrant-wise count rates Data is divided into 100 sec bins |
 |
|
| Module-wise count rates for Quadrant A Data is divided into 100 sec bins |
 |
 |
| Module-wise count rates for Quadrant B Data is divided into 100 sec bins |
 |
 |
| Module-wise count rates for Quadrant C Data is divided into 100 sec bins |
 |
 |
| Module-wise count rates for Quadrant D Data is divided into 100 sec bins |
 |
 |
| Parameter | Plot |
|---|---|
| CZT HV Monitor |  |
| D_VDD |  |
| Temperature 1 |  |
| Veto HV Monitor | 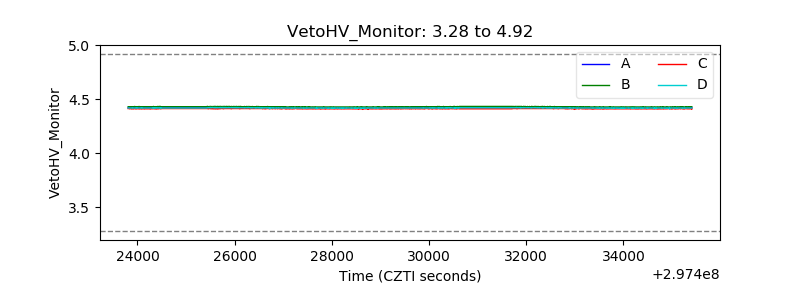 |
| Veto LLD |  |
| Alpha Counter |  |
| _CPM_Rate |  |
| CZT Counter |  |
| +2.5 Volts monitor |  |
| +5 Volts monitor | 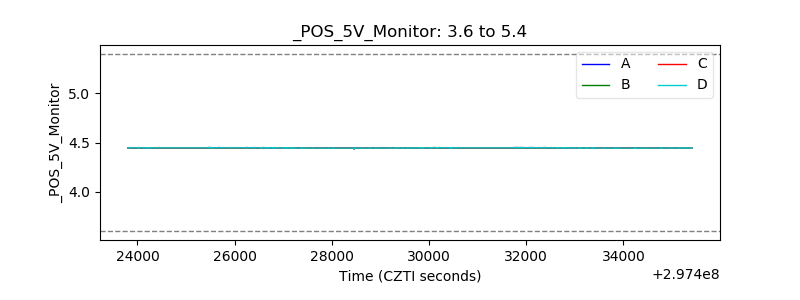 |
| _ROLL_ROT |  |
| _Roll_DEC | 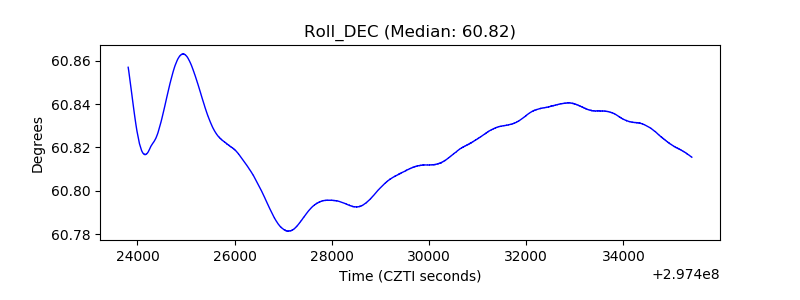 |
| _Roll_RA | 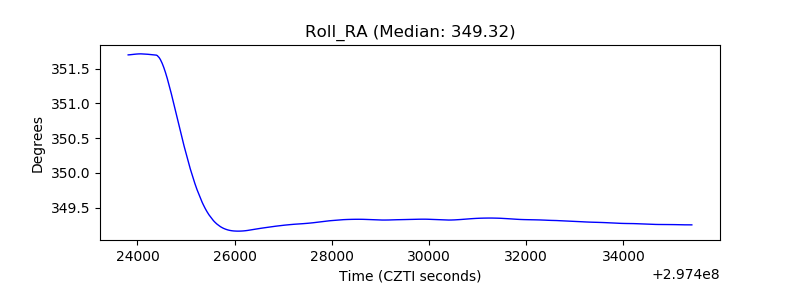 |
| Veto Counter | 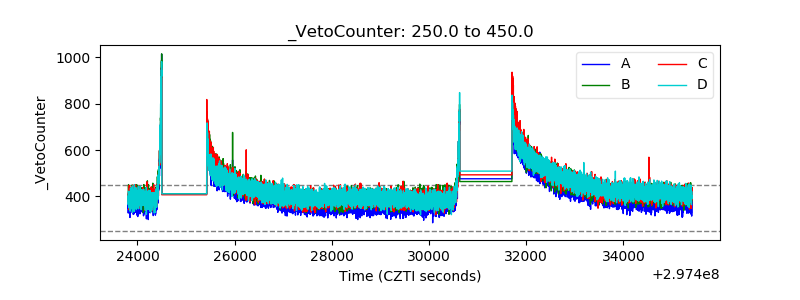 |