| Param | Original file | Final file |
|---|---|---|
| Filename | modeM0/AS1A05_160T01_9000002970cztM0_level2_bc.evt | modeM0/AS1A05_160T01_9000002970cztM0_level2_quad_clean.evt |
| Size (bytes) | 5,869,840,320 | 1,811,998,080 |
| Size | 5.5 GB | 1.7 GB |
| Events in quadrant A | 45,774,335 | 11,229,704 |
| Events in quadrant B | 33,739,351 | 11,741,956 |
| Events in quadrant C | 44,109,595 | 11,066,117 |
| Events in quadrant D | 44,384,652 | 11,022,215 |
| Mode SS | |||
|---|---|---|---|
| Quadrant | BADHDUFLAG | Total packets | Discarded packets |
| A | 0 | 2918 | 0 |
| B | 0 | 2918 | 0 |
| C | 0 | 2918 | 0 |
| D | 0 | 2918 | 0 |
| Mode M0 | |||
|---|---|---|---|
| Quadrant | BADHDUFLAG | Total packets | Discarded packets |
| A | 0 | 388750 | 0 |
| B | 0 | 314894 | 0 |
| C | 0 | 363392 | 0 |
| D | 0 | 348553 | 0 |
| Mode M9 | |||
|---|---|---|---|
| Quadrant | BADHDUFLAG | Total packets | Discarded packets |
| A | 0 | 230 | 0 |
| B | 0 | 230 | 0 |
| C | 0 | 230 | 0 |
| D | 0 | 230 | 0 |
| Quadrant | Total seconds | Saturated seconds | Saturation percentage |
|---|---|---|---|
| A | 143348 | 12476 | 8.703295% |
| B | 143348 | 2476 | 1.727265% |
| C | 143348 | 6212 | 4.333510% |
| D | 143348 | 5003 | 3.490108% |
Noise dominated data is calculated using 1-second bins in cleaned event files. If a bin has >2000 counts, and if more than 50% of those come from <1% of pixels, then it is considered to be noise-dominated and hence unusable.
| Quadrant | # 1 sec bins | Bins with >0 counts | Bins with >2000 counts | High rate bins dominated by noise | Noise dominated (total time) | Noise dominated (detector-on time) | Marked lightcurve |
|---|---|---|---|---|---|---|---|
| A | 165807 | 143313 | 93 | 93 | 0.06% | 0.06% |  |
| B | 165807 | 143325 | 13 | 13 | 0.01% | 0.01% |  |
| C | 165807 | 143324 | 92 | 92 | 0.06% | 0.06% |  |
| D | 165808 | 143335 | 923 | 923 | 0.56% | 0.64% |  |
Top three noisy pixels from each quadrant. If the there are fewer than three noisy pixels in the level2.evt file, extra rows are filled as -1
| Pixel properties | Quadrant properties | ||||||
|---|---|---|---|---|---|---|---|
| Quadrant | DetID | PixID | Counts | Sigma | Mean | Median | Sigma |
| A | 14 | 238 | 16007494 | 9781.49 | 7555 | 7413 | 1635.8 |
| A | 5 | 16 | 436172 | 262.12 | 7555 | 7413 | 1635.8 |
| A | 3 | 1 | 175313 | 102.64 | 7555 | 7413 | 1635.8 |
| B | 7 | 220 | 1195537 | 812.99 | 7881 | 7689 | 1461.1 |
| B | 0 | 189 | 418743 | 281.33 | 7881 | 7689 | 1461.1 |
| B | 0 | 197 | 403513 | 270.91 | 7881 | 7689 | 1461.1 |
| C | 3 | 233 | 7588326 | 4368.29 | 7443 | 7414 | 1735.4 |
| C | 4 | 254 | 4854529 | 2793.02 | 7443 | 7414 | 1735.4 |
| C | 9 | 221 | 2540578 | 1459.67 | 7443 | 7414 | 1735.4 |
| D | 1 | 52 | 7302182 | 4113.78 | 7696 | 7422 | 1773.2 |
| D | 1 | 20 | 2123022 | 1193.06 | 7696 | 7422 | 1773.2 |
| D | 7 | 38 | 1515779 | 850.62 | 7696 | 7422 | 1773.2 |
Histogram calculated using DETX and DETY for each event in the final _common_clean file
| Quadrant A | 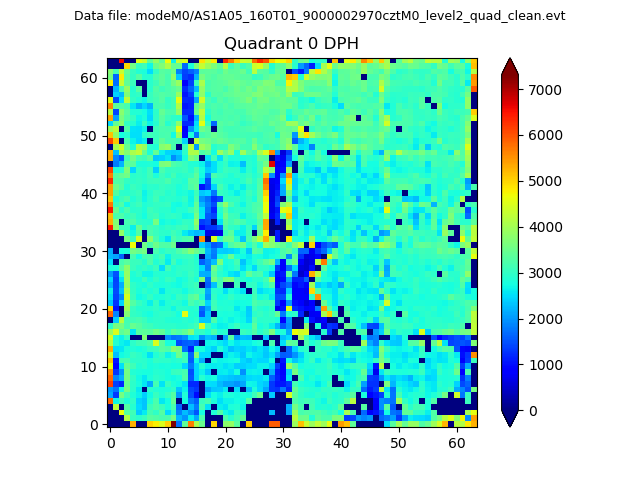 |
 |
Quadrant B |
|---|---|---|---|
| Quadrant D | 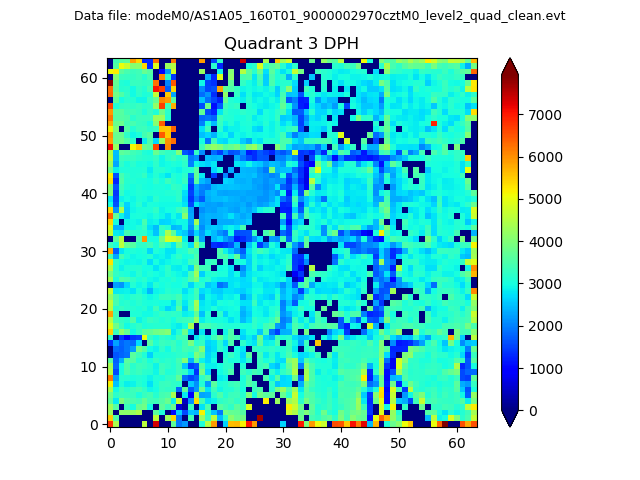 |
 |
Quadrant C |
| Plot type | Count rate plots | Images |
|---|---|---|
| Comparison with Poisson distribution Blue bars denote a histogram of data divided into 1 sec bins. Red curve is a Poisson curve with rate = median count rate of data. |
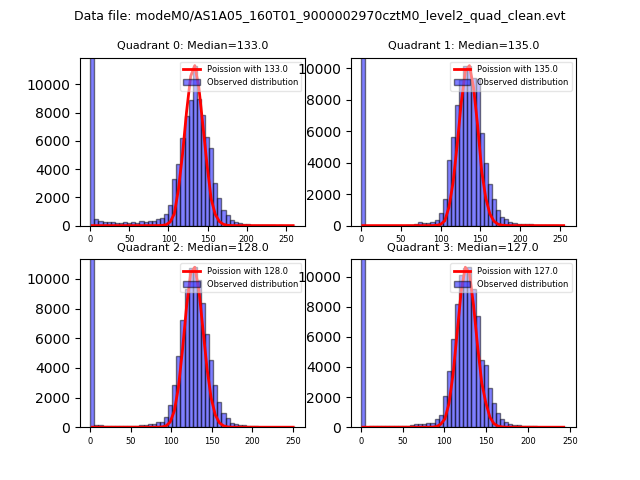 |
 |
| Quadrant-wise count rates Data is divided into 100 sec bins |
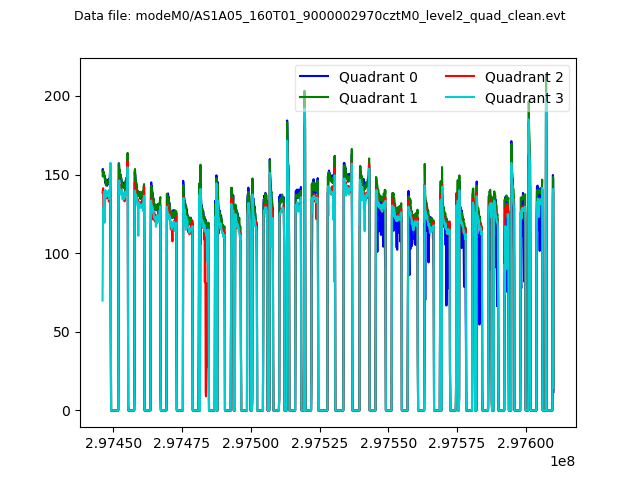 |
|
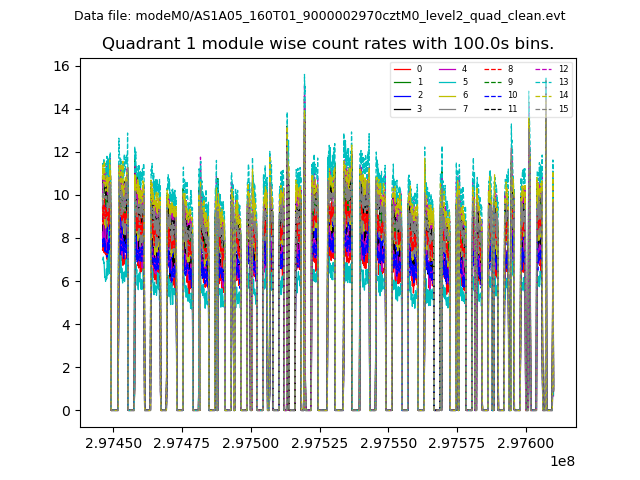
| Module-wise count rates for Quadrant A Data is divided into 100 sec bins |
 |
 |
| Module-wise count rates for Quadrant B Data is divided into 100 sec bins |
 |
 |
| Module-wise count rates for Quadrant C Data is divided into 100 sec bins |
 |
 |
| Module-wise count rates for Quadrant D Data is divided into 100 sec bins |
 |
 |
| Parameter | Plot |
|---|---|
| CZT HV Monitor |  |
| D_VDD |  |
| Temperature 1 |  |
| Veto HV Monitor |  |
| Veto LLD |  |
| Alpha Counter |  |
| _CPM_Rate |  |
| CZT Counter | 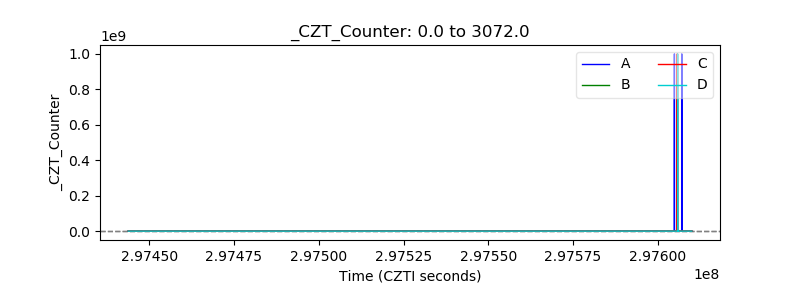 |
| +2.5 Volts monitor |  |
| +5 Volts monitor |  |
| _ROLL_ROT |  |
| _Roll_DEC |  |
| _Roll_RA |  |
| Veto Counter | 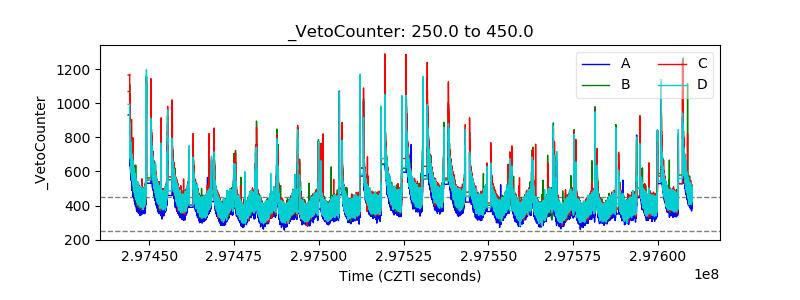 |