| Param | Original file | Final file |
|---|---|---|
| Filename | modeM0/AS1A05_064T01_9000002964cztM0_level2_bc.evt | modeM0/AS1A05_064T01_9000002964cztM0_level2_quad_clean.evt |
| Size (bytes) | 7,574,322,240 | 2,078,055,360 |
| Size | 7.1 GB | 1.9 GB |
| Events in quadrant A | 27,607,479 | 14,341,254 |
| Events in quadrant B | 39,207,811 | 14,415,044 |
| Events in quadrant C | 48,753,254 | 13,825,366 |
| Events in quadrant D | 104,992,193 | 11,448,052 |
| Mode M0 | |||
|---|---|---|---|
| Quadrant | BADHDUFLAG | Total packets | Discarded packets |
| A | 0 | 271098 | 0 |
| B | 0 | 311836 | 0 |
| C | 0 | 373811 | 0 |
| D | 0 | 562870 | 0 |
| Mode SS | |||
|---|---|---|---|
| Quadrant | BADHDUFLAG | Total packets | Discarded packets |
| A | 0 | 2654 | 0 |
| B | 0 | 2654 | 0 |
| C | 0 | 2654 | 0 |
| D | 0 | 2654 | 0 |
| Mode M9 | |||
|---|---|---|---|
| Quadrant | BADHDUFLAG | Total packets | Discarded packets |
| A | 0 | 203 | 0 |
| B | 0 | 203 | 0 |
| C | 0 | 203 | 0 |
| D | 0 | 203 | 0 |
| Quadrant | Total seconds | Saturated seconds | Saturation percentage |
|---|---|---|---|
| A | 129887 | 1215 | 0.935428% |
| B | 129887 | 2229 | 1.716107% |
| C | 129887 | 9447 | 7.273245% |
| D | 129887 | 34676 | 26.697052% |
Noise dominated data is calculated using 1-second bins in cleaned event files. If a bin has >2000 counts, and if more than 50% of those come from <1% of pixels, then it is considered to be noise-dominated and hence unusable.
| Quadrant | # 1 sec bins | Bins with >0 counts | Bins with >2000 counts | High rate bins dominated by noise | Noise dominated (total time) | Noise dominated (detector-on time) | Marked lightcurve |
|---|---|---|---|---|---|---|---|
| A | 150447 | 129878 | 18 | 18 | 0.01% | 0.01% | 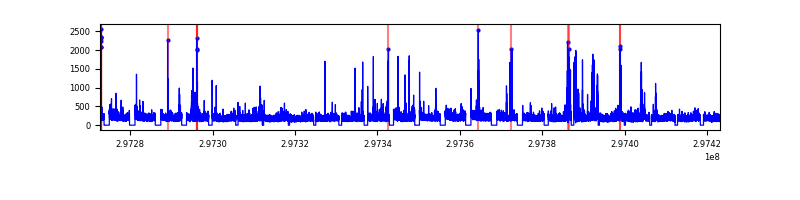 |
| B | 150447 | 129870 | 62 | 62 | 0.04% | 0.05% |  |
| C | 150447 | 129867 | 121 | 121 | 0.08% | 0.09% |  |
| D | 150447 | 129845 | 8266 | 8266 | 5.49% | 6.37% | 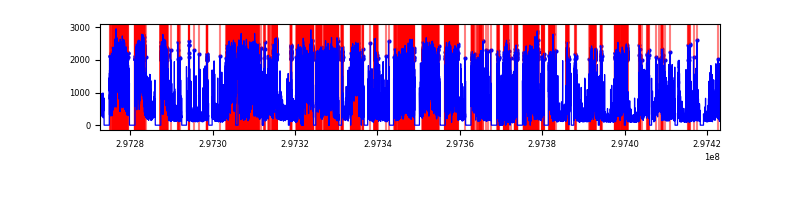 |
Top three noisy pixels from each quadrant. If the there are fewer than three noisy pixels in the level2.evt file, extra rows are filled as -1
| Pixel properties | Quadrant properties | ||||||
|---|---|---|---|---|---|---|---|
| Quadrant | DetID | PixID | Counts | Sigma | Mean | Median | Sigma |
| A | 14 | 238 | 1010187 | 684.1 | 6725 | 6607 | 1467.0 |
| A | 5 | 16 | 464851 | 312.37 | 6725 | 6607 | 1467.0 |
| A | 10 | 253 | 93037 | 58.92 | 6725 | 6607 | 1467.0 |
| B | 3 | 112 | 7963765 | 6254.17 | 6778 | 6620 | 1272.3 |
| B | 7 | 220 | 1487584 | 1164.01 | 6778 | 6620 | 1272.3 |
| B | 0 | 197 | 652307 | 507.5 | 6778 | 6620 | 1272.3 |
| C | 9 | 221 | 16795570 | 10840.68 | 6466 | 6444 | 1548.7 |
| C | 4 | 254 | 4466953 | 2880.14 | 6466 | 6444 | 1548.7 |
| C | 3 | 233 | 1827198 | 1175.65 | 6466 | 6444 | 1548.7 |
| D | 2 | 184 | 39190642 | 28281.83 | 5812 | 5609 | 1385.5 |
| D | 7 | 38 | 21346997 | 15403.16 | 5812 | 5609 | 1385.5 |
| D | 1 | 52 | 6051943 | 4363.95 | 5812 | 5609 | 1385.5 |
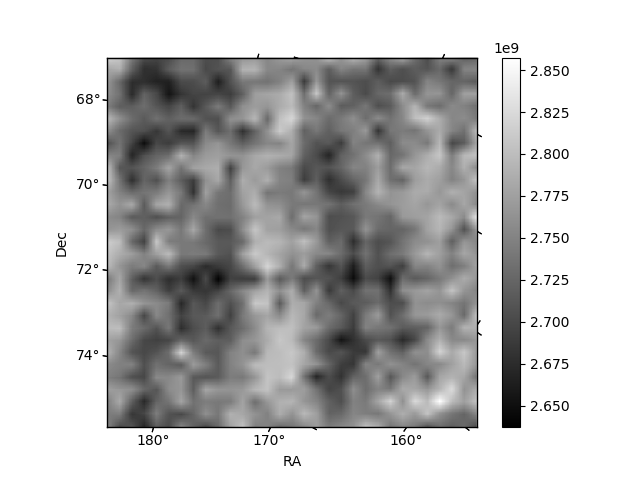
Histogram calculated using DETX and DETY for each event in the final _common_clean file
| Quadrant A |  |
 |
Quadrant B |
|---|---|---|---|
| Quadrant D |  |
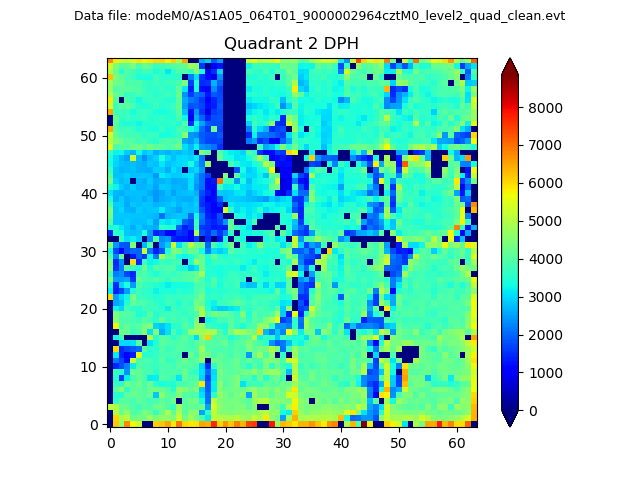 |
Quadrant C |
| Plot type | Count rate plots | Images |
|---|---|---|
| Comparison with Poisson distribution Blue bars denote a histogram of data divided into 1 sec bins. Red curve is a Poisson curve with rate = median count rate of data. |
 |
 |
| Quadrant-wise count rates Data is divided into 100 sec bins |
 |
|
| Module-wise count rates for Quadrant A Data is divided into 100 sec bins |
 |
 |
| Module-wise count rates for Quadrant B Data is divided into 100 sec bins |
 |
 |
| Module-wise count rates for Quadrant C Data is divided into 100 sec bins |
 |
 |
| Module-wise count rates for Quadrant D Data is divided into 100 sec bins |
 |
 |
| Parameter | Plot |
|---|---|
| CZT HV Monitor | 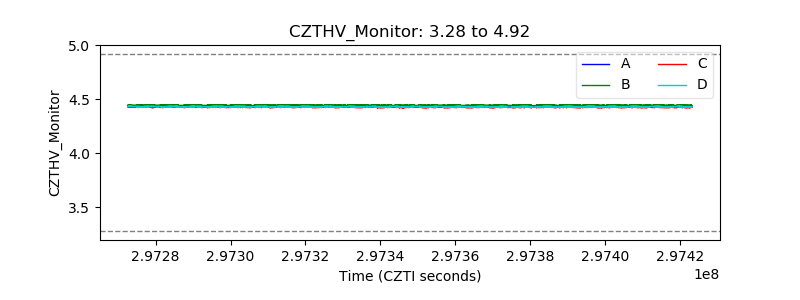 |
| D_VDD |  |
| Temperature 1 |  |
| Veto HV Monitor |  |
| Veto LLD |  |
| Alpha Counter |  |
| _CPM_Rate |  |
| CZT Counter |  |
| +2.5 Volts monitor |  |
| +5 Volts monitor |  |
| _ROLL_ROT |  |
| _Roll_DEC |  |
| _Roll_RA |  |
| Veto Counter |  |