| Param | Original file | Final file |
|---|---|---|
| Filename | modeM0/AS1T03_118T01_9000002962cztM0_level2_bc.evt | modeM0/AS1T03_118T01_9000002962cztM0_level2_quad_clean.evt |
| Size (bytes) | 16,845,220,800 | 5,476,394,880 |
| Size | 15.7 GB | 5.1 GB |
| Events in quadrant A | 158,986,221 | 34,098,865 |
| Events in quadrant B | 92,843,391 | 35,923,335 |
| Events in quadrant C | 96,678,312 | 34,231,629 |
| Events in quadrant D | 133,309,794 | 33,100,223 |
| Mode SS | |||
|---|---|---|---|
| Quadrant | BADHDUFLAG | Total packets | Discarded packets |
| A | 0 | 8478 | 0 |
| B | 0 | 8478 | 0 |
| C | 0 | 8478 | 0 |
| D | 0 | 8478 | 0 |
| Mode M9 | |||
|---|---|---|---|
| Quadrant | BADHDUFLAG | Total packets | Discarded packets |
| A | 0 | 648 | 0 |
| B | 0 | 648 | 0 |
| C | 0 | 648 | 0 |
| D | 0 | 648 | 0 |
| Mode M0 | |||
|---|---|---|---|
| Quadrant | BADHDUFLAG | Total packets | Discarded packets |
| A | 0 | 1183155 | 0 |
| B | 0 | 887039 | 0 |
| C | 0 | 913412 | 0 |
| D | 0 | 1030435 | 0 |
| Quadrant | Total seconds | Saturated seconds | Saturation percentage |
|---|---|---|---|
| A | 416489 | 40788 | 9.793296% |
| B | 416490 | 6917 | 1.660784% |
| C | 416490 | 9232 | 2.216620% |
| D | 416490 | 15273 | 3.667075% |
Noise dominated data is calculated using 1-second bins in cleaned event files. If a bin has >2000 counts, and if more than 50% of those come from <1% of pixels, then it is considered to be noise-dominated and hence unusable.
| Quadrant | # 1 sec bins | Bins with >0 counts | Bins with >2000 counts | High rate bins dominated by noise | Noise dominated (total time) | Noise dominated (detector-on time) | Marked lightcurve |
|---|---|---|---|---|---|---|---|
| A | 483194 | 414553 | 2182 | 2182 | 0.45% | 0.53% |  |
| B | 483194 | 414554 | 188 | 188 | 0.04% | 0.05% |  |
| C | 483194 | 414553 | 274 | 274 | 0.06% | 0.07% |  |
| D | 483194 | 414550 | 2659 | 2659 | 0.55% | 0.64% |  |
Top three noisy pixels from each quadrant. If the there are fewer than three noisy pixels in the level2.evt file, extra rows are filled as -1
| Pixel properties | Quadrant properties | ||||||
|---|---|---|---|---|---|---|---|
| Quadrant | DetID | PixID | Counts | Sigma | Mean | Median | Sigma |
| A | 14 | 238 | 70999053 | 15324.82 | 21396 | 21017 | 4631.6 |
| A | 5 | 16 | 3466777 | 743.97 | 21396 | 21017 | 4631.6 |
| A | 14 | 254 | 1694544 | 361.33 | 21396 | 21017 | 4631.6 |
| B | 7 | 220 | 1570002 | 369.83 | 22495 | 21901 | 4186.0 |
| B | 10 | 245 | 931324 | 217.25 | 22495 | 21901 | 4186.0 |
| B | 3 | 64 | 848044 | 197.36 | 22495 | 21901 | 4186.0 |
| C | 9 | 221 | 13100846 | 2563.11 | 21605 | 21481 | 5102.9 |
| C | 7 | 220 | 212327 | 37.4 | 21605 | 21481 | 5102.9 |
| C | 3 | 233 | 186745 | 32.39 | 21605 | 21481 | 5102.9 |
| D | 1 | 52 | 26545686 | 5304.41 | 21781 | 21020 | 5000.5 |
| D | 2 | 184 | 6247402 | 1245.15 | 21781 | 21020 | 5000.5 |
| D | 1 | 20 | 5847852 | 1165.25 | 21781 | 21020 | 5000.5 |
Histogram calculated using DETX and DETY for each event in the final _common_clean file
| Quadrant A |  |
 |
Quadrant B |
|---|---|---|---|
| Quadrant D |  |
 |
Quadrant C |
| Plot type | Count rate plots | Images |
|---|---|---|
| Comparison with Poisson distribution Blue bars denote a histogram of data divided into 1 sec bins. Red curve is a Poisson curve with rate = median count rate of data. |
 |
 |
| Quadrant-wise count rates Data is divided into 100 sec bins |
 |
|
| Module-wise count rates for Quadrant A Data is divided into 100 sec bins |
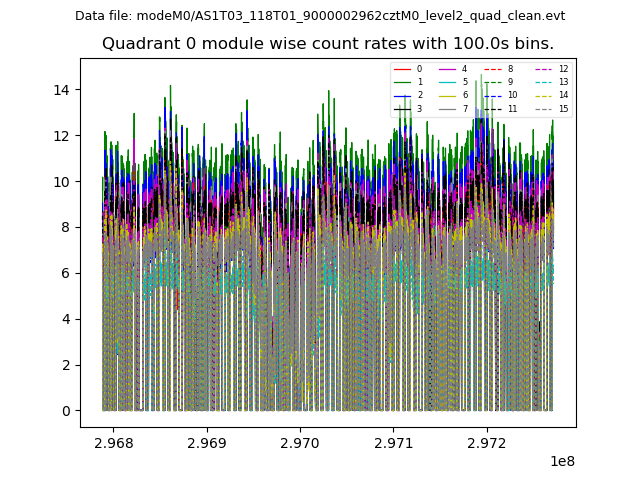 |
 |
| Module-wise count rates for Quadrant B Data is divided into 100 sec bins |
 |
 |
| Module-wise count rates for Quadrant C Data is divided into 100 sec bins |
 |
 |
| Module-wise count rates for Quadrant D Data is divided into 100 sec bins |
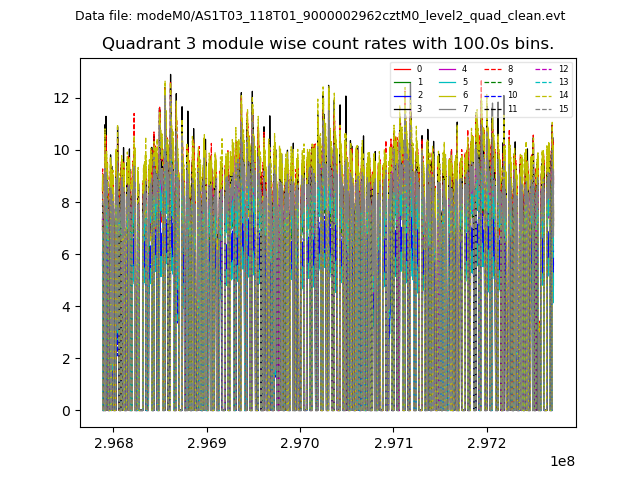 |
 |
| Parameter | Plot |
|---|---|
| CZT HV Monitor |  |
| D_VDD |  |
| Temperature 1 |  |
| Veto HV Monitor |  |
| Veto LLD |  |
| Alpha Counter |  |
| _CPM_Rate | 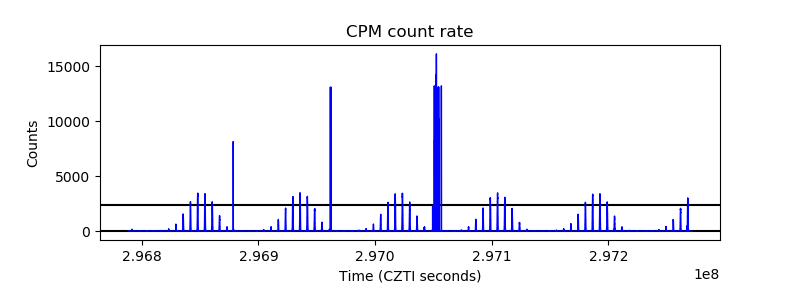 |
| CZT Counter |  |
| +2.5 Volts monitor |  |
| +5 Volts monitor |  |
| _ROLL_ROT |  |
| _Roll_DEC |  |
| _Roll_RA |  |
| Veto Counter | 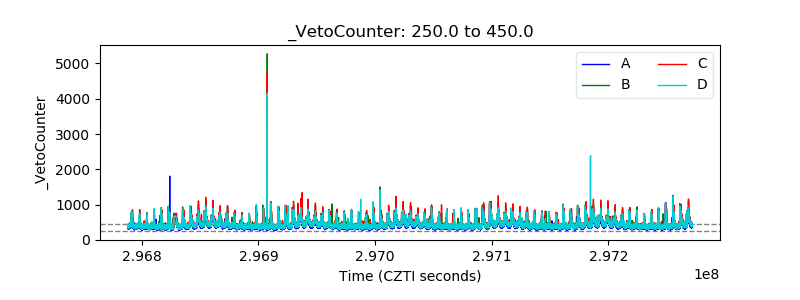 |