| Param | Original file | Final file |
|---|---|---|
| Filename | modeM0/AS1C04_009T06_9000002960cztM0_level2_bc.evt | modeM0/AS1C04_009T06_9000002960cztM0_level2_quad_clean.evt |
| Size (bytes) | 3,333,795,840 | 1,366,044,480 |
| Size | 3.1 GB | 1.3 GB |
| Events in quadrant A | 19,143,211 | 9,244,944 |
| Events in quadrant B | 19,078,717 | 9,514,323 |
| Events in quadrant C | 15,139,618 | 9,300,103 |
| Events in quadrant D | 42,633,835 | 8,313,630 |
| Mode SS | |||
|---|---|---|---|
| Quadrant | BADHDUFLAG | Total packets | Discarded packets |
| A | 0 | 1484 | 0 |
| B | 0 | 1484 | 0 |
| C | 0 | 1484 | 0 |
| D | 0 | 1484 | 0 |
| Mode M9 | |||
|---|---|---|---|
| Quadrant | BADHDUFLAG | Total packets | Discarded packets |
| A | 0 | 126 | 0 |
| B | 0 | 126 | 0 |
| C | 0 | 126 | 0 |
| D | 0 | 126 | 0 |
| Mode M0 | |||
|---|---|---|---|
| Quadrant | BADHDUFLAG | Total packets | Discarded packets |
| A | 0 | 168381 | 0 |
| B | 0 | 165139 | 0 |
| C | 0 | 152568 | 0 |
| D | 0 | 256528 | 0 |
| Quadrant | Total seconds | Saturated seconds | Saturation percentage |
|---|---|---|---|
| A | 72976 | 2577 | 3.531298% |
| B | 72976 | 1610 | 2.206205% |
| C | 72976 | 1156 | 1.584082% |
| D | 72976 | 11305 | 15.491394% |
Noise dominated data is calculated using 1-second bins in cleaned event files. If a bin has >2000 counts, and if more than 50% of those come from <1% of pixels, then it is considered to be noise-dominated and hence unusable.
| Quadrant | # 1 sec bins | Bins with >0 counts | Bins with >2000 counts | High rate bins dominated by noise | Noise dominated (total time) | Noise dominated (detector-on time) | Marked lightcurve |
|---|---|---|---|---|---|---|---|
| A | 85236 | 72972 | 177 | 177 | 0.21% | 0.24% | 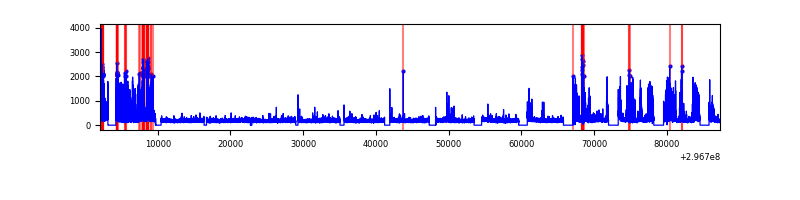 |
| B | 85236 | 72966 | 87 | 87 | 0.10% | 0.12% |  |
| C | 85236 | 72971 | 49 | 49 | 0.06% | 0.07% |  |
| D | 85236 | 72967 | 1528 | 1528 | 1.79% | 2.09% |  |
Top three noisy pixels from each quadrant. If the there are fewer than three noisy pixels in the level2.evt file, extra rows are filled as -1
| Pixel properties | Quadrant properties | ||||||
|---|---|---|---|---|---|---|---|
| Quadrant | DetID | PixID | Counts | Sigma | Mean | Median | Sigma |
| A | 6 | 16 | 2309787 | 2831.31 | 3729 | 3660 | 814.5 |
| A | 14 | 238 | 2102375 | 2576.67 | 3729 | 3660 | 814.5 |
| A | 14 | 254 | 146226 | 175.03 | 3729 | 3660 | 814.5 |
| B | 10 | 245 | 2529712 | 3511.93 | 3812 | 3722 | 719.3 |
| B | 7 | 220 | 552092 | 762.41 | 3812 | 3722 | 719.3 |
| B | 4 | 216 | 337604 | 464.2 | 3812 | 3722 | 719.3 |
| C | 3 | 233 | 402318 | 454.29 | 3699 | 3689 | 877.5 |
| C | 5 | 112 | 400276 | 451.96 | 3699 | 3689 | 877.5 |
| C | 0 | 207 | 103300 | 113.52 | 3699 | 3689 | 877.5 |
| D | 1 | 52 | 7838636 | 9440.93 | 3504 | 3381 | 829.9 |
| D | 7 | 238 | 6748779 | 8127.72 | 3504 | 3381 | 829.9 |
| D | 7 | 38 | 6237772 | 7512.0 | 3504 | 3381 | 829.9 |
Histogram calculated using DETX and DETY for each event in the final _common_clean file
| Quadrant A | 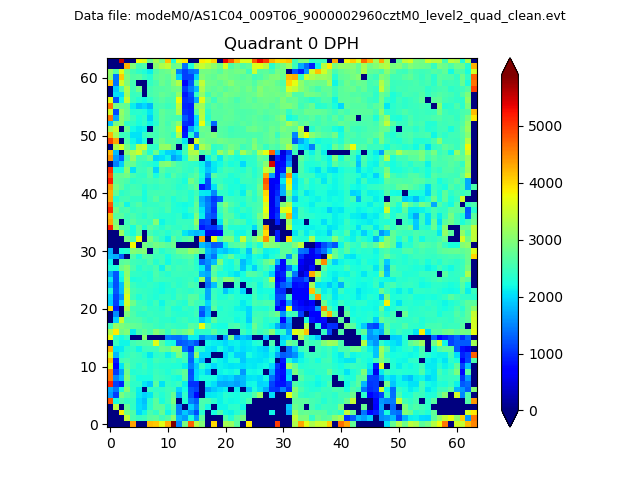 |
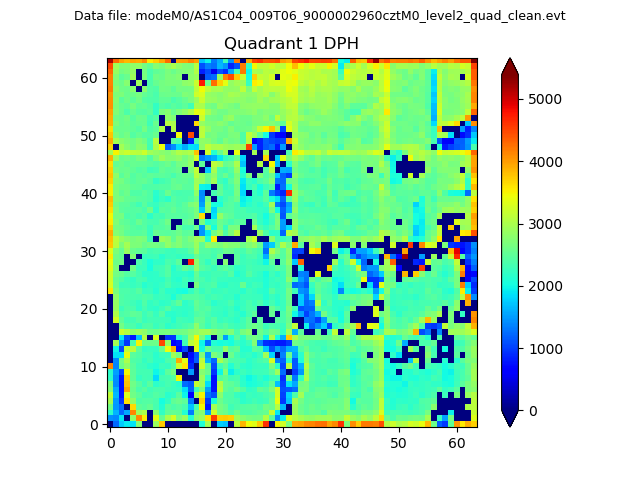 |
Quadrant B |
|---|---|---|---|
| Quadrant D |  |
 |
Quadrant C |
| Plot type | Count rate plots | Images |
|---|---|---|
| Comparison with Poisson distribution Blue bars denote a histogram of data divided into 1 sec bins. Red curve is a Poisson curve with rate = median count rate of data. |
 |
 |
| Quadrant-wise count rates Data is divided into 100 sec bins |
 |
|
| Module-wise count rates for Quadrant A Data is divided into 100 sec bins |
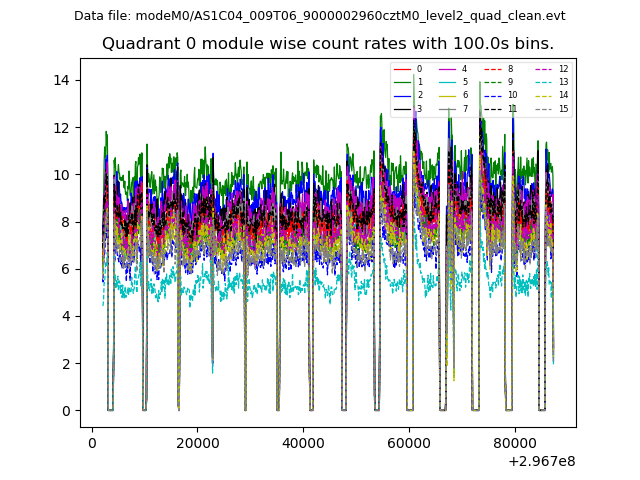 |
 |
| Module-wise count rates for Quadrant B Data is divided into 100 sec bins |
 |
 |
| Module-wise count rates for Quadrant C Data is divided into 100 sec bins |
 |
 |
| Module-wise count rates for Quadrant D Data is divided into 100 sec bins |
 |
 |
| Parameter | Plot |
|---|---|
| CZT HV Monitor |  |
| D_VDD |  |
| Temperature 1 |  |
| Veto HV Monitor |  |
| Veto LLD | 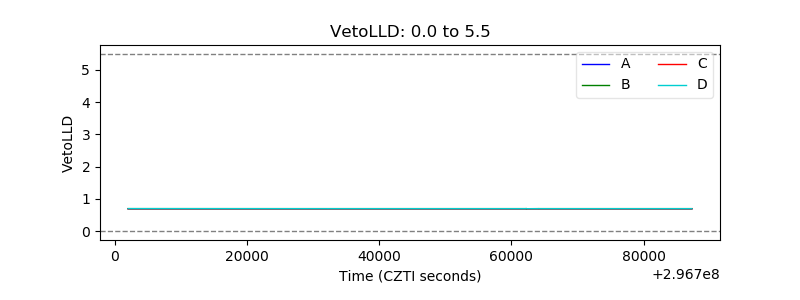 |
| Alpha Counter |  |
| _CPM_Rate | 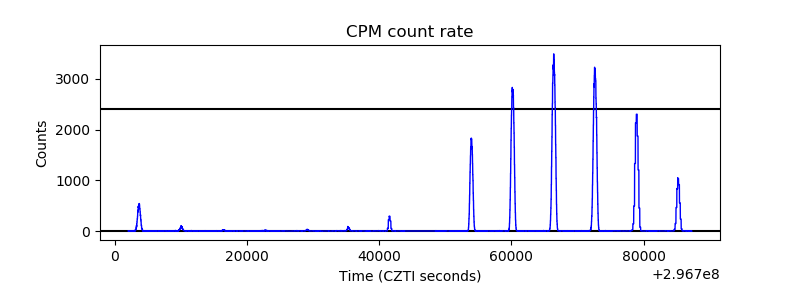 |
| CZT Counter | 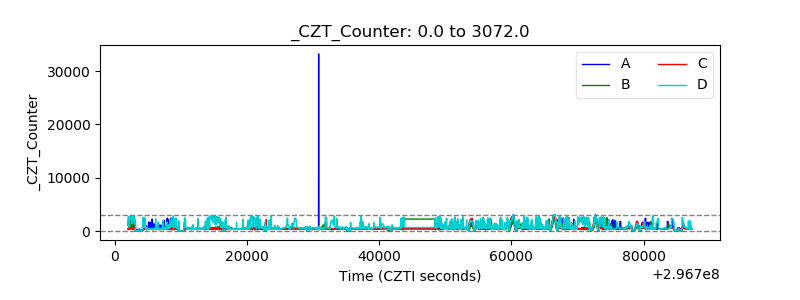 |
| +2.5 Volts monitor |  |
| +5 Volts monitor | 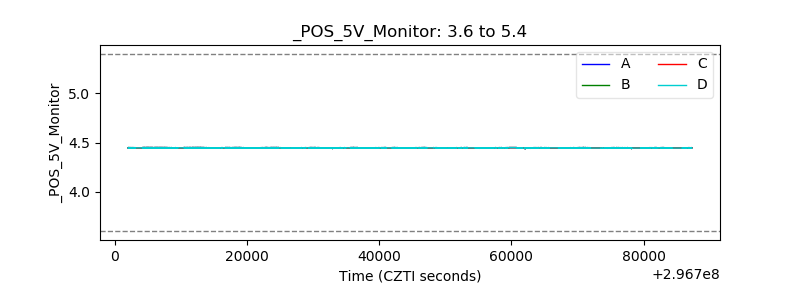 |
| _ROLL_ROT |  |
| _Roll_DEC |  |
| _Roll_RA |  |
| Veto Counter |  |