| Param | Original file | Final file |
|---|---|---|
| Filename | modeM0/AS1A05_117T01_9000002958cztM0_level2_bc.evt | modeM0/AS1A05_117T01_9000002958cztM0_level2_quad_clean.evt |
| Size (bytes) | 5,681,554,560 | 1,589,906,880 |
| Size | 5.3 GB | 1.5 GB |
| Events in quadrant A | 61,069,195 | 9,973,152 |
| Events in quadrant B | 26,058,745 | 10,605,434 |
| Events in quadrant C | 36,589,513 | 9,908,651 |
| Events in quadrant D | 40,576,926 | 9,832,842 |
| Mode M9 | |||
|---|---|---|---|
| Quadrant | BADHDUFLAG | Total packets | Discarded packets |
| A | 0 | 209 | 0 |
| B | 0 | 209 | 0 |
| C | 0 | 209 | 0 |
| D | 0 | 209 | 0 |
| Mode M0 | |||
|---|---|---|---|
| Quadrant | BADHDUFLAG | Total packets | Discarded packets |
| A | 0 | 351566 | 0 |
| B | 0 | 246192 | 0 |
| C | 0 | 290919 | 0 |
| D | 0 | 294263 | 0 |
| Mode SS | |||
|---|---|---|---|
| Quadrant | BADHDUFLAG | Total packets | Discarded packets |
| A | 0 | 2324 | 0 |
| B | 0 | 2324 | 0 |
| C | 0 | 2324 | 0 |
| D | 0 | 2324 | 0 |
| Quadrant | Total seconds | Saturated seconds | Saturation percentage |
|---|---|---|---|
| A | 114348 | 10123 | 8.852800% |
| B | 114348 | 2021 | 1.767412% |
| C | 114348 | 6894 | 6.028964% |
| D | 114348 | 5270 | 4.608738% |
Noise dominated data is calculated using 1-second bins in cleaned event files. If a bin has >2000 counts, and if more than 50% of those come from <1% of pixels, then it is considered to be noise-dominated and hence unusable.
| Quadrant | # 1 sec bins | Bins with >0 counts | Bins with >2000 counts | High rate bins dominated by noise | Noise dominated (total time) | Noise dominated (detector-on time) | Marked lightcurve |
|---|---|---|---|---|---|---|---|
| A | 134593 | 114339 | 5547 | 5547 | 4.12% | 4.85% | 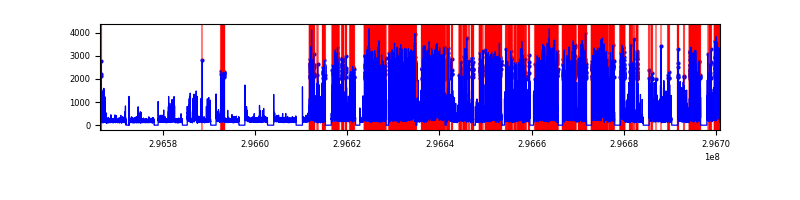 |
| B | 134593 | 114334 | 28 | 28 | 0.02% | 0.02% |  |
| C | 134593 | 114338 | 245 | 245 | 0.18% | 0.21% |  |
| D | 134593 | 114340 | 832 | 832 | 0.62% | 0.73% |  |
Top three noisy pixels from each quadrant. If the there are fewer than three noisy pixels in the level2.evt file, extra rows are filled as -1
| Pixel properties | Quadrant properties | ||||||
|---|---|---|---|---|---|---|---|
| Quadrant | DetID | PixID | Counts | Sigma | Mean | Median | Sigma |
| A | 6 | 16 | 36381239 | 28265.26 | 5981 | 5878 | 1286.9 |
| A | 10 | 253 | 555118 | 426.78 | 5981 | 5878 | 1286.9 |
| A | 0 | 23 | 447596 | 343.23 | 5981 | 5878 | 1286.9 |
| B | 7 | 220 | 1001377 | 860.42 | 6219 | 6078 | 1156.8 |
| B | 4 | 216 | 249812 | 210.71 | 6219 | 6078 | 1156.8 |
| B | 3 | 64 | 203129 | 170.35 | 6219 | 6078 | 1156.8 |
| C | 3 | 233 | 13919657 | 10174.1 | 5841 | 5817 | 1367.6 |
| C | 7 | 247 | 159000 | 112.01 | 5841 | 5817 | 1367.6 |
| C | 8 | 208 | 39113 | 24.35 | 5841 | 5817 | 1367.6 |
| D | 1 | 52 | 7190930 | 5232.68 | 6014 | 5831 | 1373.1 |
| D | 7 | 238 | 6615761 | 4813.8 | 6014 | 5831 | 1373.1 |
| D | 12 | 218 | 1543157 | 1119.58 | 6014 | 5831 | 1373.1 |
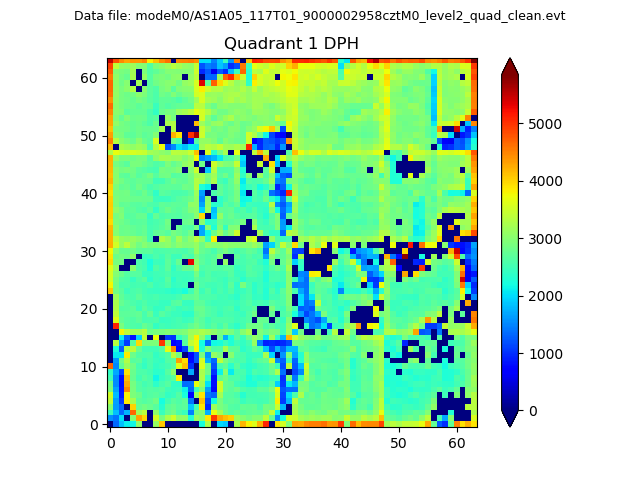
Histogram calculated using DETX and DETY for each event in the final _common_clean file
| Quadrant A |  |
 |
Quadrant B |
|---|---|---|---|
| Quadrant D |  |
 |
Quadrant C |
| Plot type | Count rate plots | Images |
|---|---|---|
| Comparison with Poisson distribution Blue bars denote a histogram of data divided into 1 sec bins. Red curve is a Poisson curve with rate = median count rate of data. |
 |
 |
| Quadrant-wise count rates Data is divided into 100 sec bins |
 |
|
| Module-wise count rates for Quadrant A Data is divided into 100 sec bins |
 |
 |
| Module-wise count rates for Quadrant B Data is divided into 100 sec bins |
 |
 |
| Module-wise count rates for Quadrant C Data is divided into 100 sec bins |
 |
 |
| Module-wise count rates for Quadrant D Data is divided into 100 sec bins |
 |
 |
| Parameter | Plot |
|---|---|
| CZT HV Monitor | 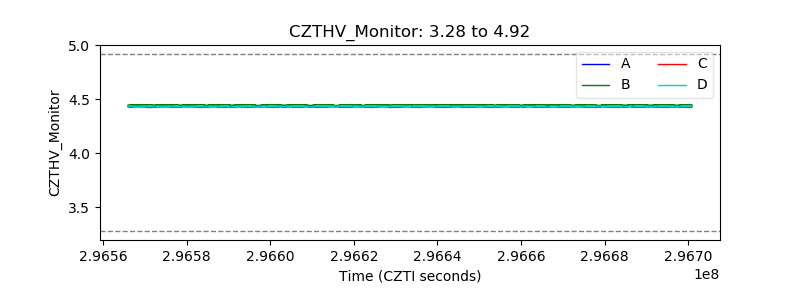 |
| D_VDD | 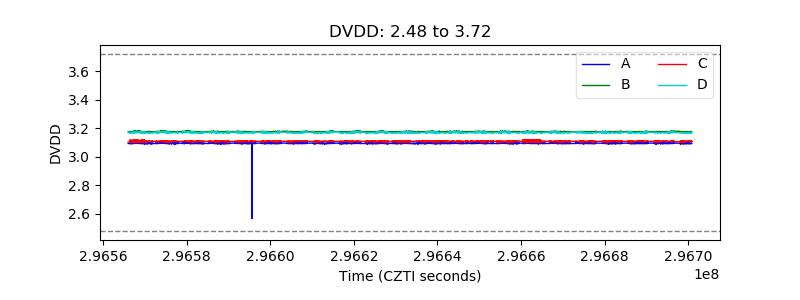 |
| Temperature 1 |  |
| Veto HV Monitor |  |
| Veto LLD |  |
| Alpha Counter |  |
| _CPM_Rate |  |
| CZT Counter | 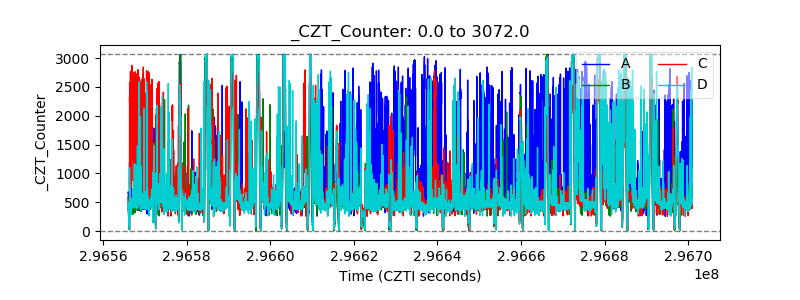 |
| +2.5 Volts monitor |  |
| +5 Volts monitor |  |
| _ROLL_ROT |  |
| _Roll_DEC |  |
| _Roll_RA |  |
| Veto Counter |  |