| Param | Original file | Final file |
|---|---|---|
| Filename | modeM0/AS1A05_104T08_9000002954cztM0_level2_bc.evt | modeM0/AS1A05_104T08_9000002954cztM0_level2_quad_clean.evt |
| Size (bytes) | 1,585,897,920 | 399,225,600 |
| Size | 1.5 GB | 380.7 MB |
| Events in quadrant A | 7,476,449 | 2,543,660 |
| Events in quadrant B | 7,639,139 | 2,602,804 |
| Events in quadrant C | 19,061,153 | 2,301,308 |
| Events in quadrant D | 11,561,099 | 2,335,211 |
| Mode M0 | |||
|---|---|---|---|
| Quadrant | BADHDUFLAG | Total packets | Discarded packets |
| A | 0 | 70403 | 0 |
| B | 0 | 71183 | 0 |
| C | 0 | 115179 | 0 |
| D | 0 | 83929 | 0 |
| Mode M9 | |||
|---|---|---|---|
| Quadrant | BADHDUFLAG | Total packets | Discarded packets |
| A | 0 | 72 | 0 |
| B | 0 | 72 | 0 |
| C | 0 | 72 | 0 |
| D | 0 | 72 | 0 |
| Mode SS | |||
|---|---|---|---|
| Quadrant | BADHDUFLAG | Total packets | Discarded packets |
| A | 0 | 684 | 0 |
| B | 0 | 684 | 0 |
| C | 0 | 684 | 0 |
| D | 0 | 684 | 0 |
| Quadrant | Total seconds | Saturated seconds | Saturation percentage |
|---|---|---|---|
| A | 33578 | 277 | 0.824945% |
| B | 33578 | 373 | 1.110846% |
| C | 33578 | 5683 | 16.924772% |
| D | 33578 | 1221 | 3.636309% |
Noise dominated data is calculated using 1-second bins in cleaned event files. If a bin has >2000 counts, and if more than 50% of those come from <1% of pixels, then it is considered to be noise-dominated and hence unusable.
| Quadrant | # 1 sec bins | Bins with >0 counts | Bins with >2000 counts | High rate bins dominated by noise | Noise dominated (total time) | Noise dominated (detector-on time) | Marked lightcurve |
|---|---|---|---|---|---|---|---|
| A | 40858 | 33580 | 21 | 21 | 0.05% | 0.06% |  |
| B | 40858 | 33578 | 22 | 22 | 0.05% | 0.07% |  |
| C | 40858 | 33579 | 788 | 788 | 1.93% | 2.35% |  |
| D | 40858 | 33577 | 462 | 462 | 1.13% | 1.38% | 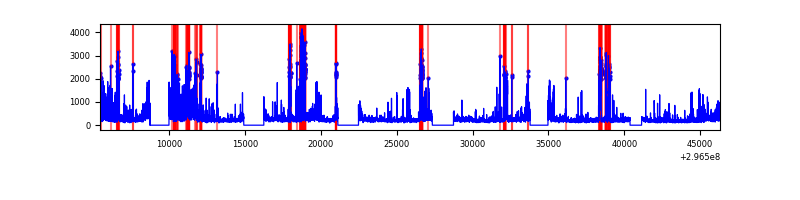 |
Top three noisy pixels from each quadrant. If the there are fewer than three noisy pixels in the level2.evt file, extra rows are filled as -1
| Pixel properties | Quadrant properties | ||||||
|---|---|---|---|---|---|---|---|
| Quadrant | DetID | PixID | Counts | Sigma | Mean | Median | Sigma |
| A | 6 | 16 | 206628 | 517.77 | 1844 | 1810 | 395.6 |
| A | 9 | 143 | 56514 | 138.29 | 1844 | 1810 | 395.6 |
| A | 0 | 23 | 43800 | 106.15 | 1844 | 1810 | 395.6 |
| B | 7 | 220 | 119888 | 337.08 | 1879 | 1836 | 350.2 |
| B | 4 | 216 | 91864 | 257.06 | 1879 | 1836 | 350.2 |
| B | 3 | 64 | 62130 | 172.16 | 1879 | 1836 | 350.2 |
| C | 3 | 233 | 12653530 | 32911.75 | 1648 | 1642 | 384.4 |
| C | 7 | 247 | 30642 | 75.44 | 1648 | 1642 | 384.4 |
| C | 4 | 175 | 28084 | 68.78 | 1648 | 1642 | 384.4 |
| D | 7 | 238 | 3006120 | 7347.11 | 1775 | 1712 | 408.9 |
| D | 1 | 52 | 987306 | 2410.21 | 1775 | 1712 | 408.9 |
| D | 12 | 218 | 459060 | 1118.42 | 1775 | 1712 | 408.9 |
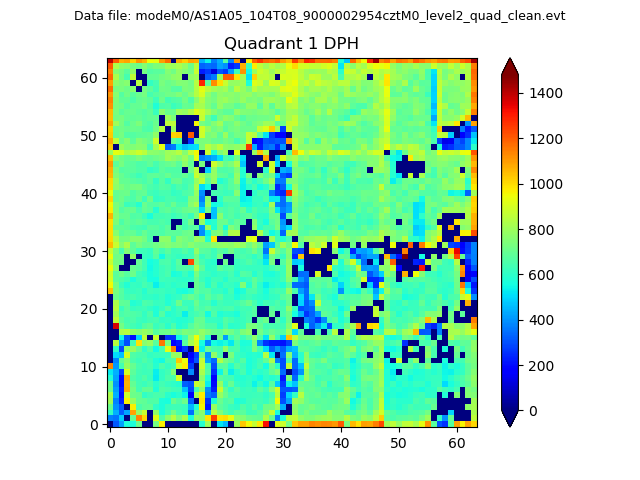
Histogram calculated using DETX and DETY for each event in the final _common_clean file
| Quadrant A |  |
 |
Quadrant B |
|---|---|---|---|
| Quadrant D |  |
 |
Quadrant C |
| Plot type | Count rate plots | Images |
|---|---|---|
| Comparison with Poisson distribution Blue bars denote a histogram of data divided into 1 sec bins. Red curve is a Poisson curve with rate = median count rate of data. |
 |
 |
| Quadrant-wise count rates Data is divided into 100 sec bins |
 |
|
| Module-wise count rates for Quadrant A Data is divided into 100 sec bins |
 |
 |
| Module-wise count rates for Quadrant B Data is divided into 100 sec bins |
 |
 |
| Module-wise count rates for Quadrant C Data is divided into 100 sec bins |
 |
 |
| Module-wise count rates for Quadrant D Data is divided into 100 sec bins |
 |
 |
| Parameter | Plot |
|---|---|
| CZT HV Monitor |  |
| D_VDD |  |
| Temperature 1 |  |
| Veto HV Monitor |  |
| Veto LLD |  |
| Alpha Counter |  |
| _CPM_Rate |  |
| CZT Counter |  |
| +2.5 Volts monitor |  |
| +5 Volts monitor |  |
| _ROLL_ROT |  |
| _Roll_DEC |  |
| _Roll_RA |  |
| Veto Counter |  |