| Param | Original file | Final file |
|---|---|---|
| Filename | modeM0/AS1A05_088T05_9000002952cztM0_level2_bc.evt | modeM0/AS1A05_088T05_9000002952cztM0_level2_quad_clean.evt |
| Size (bytes) | 1,918,059,840 | 467,130,240 |
| Size | 1.8 GB | 445.5 MB |
| Events in quadrant A | 7,469,272 | 3,088,501 |
| Events in quadrant B | 7,262,181 | 3,135,076 |
| Events in quadrant C | 24,924,606 | 2,651,552 |
| Events in quadrant D | 15,973,307 | 2,792,366 |
| Mode M0 | |||
|---|---|---|---|
| Quadrant | BADHDUFLAG | Total packets | Discarded packets |
| A | 0 | 75391 | 0 |
| B | 0 | 74742 | 0 |
| C | 0 | 135940 | 0 |
| D | 0 | 107918 | 0 |
| Mode SS | |||
|---|---|---|---|
| Quadrant | BADHDUFLAG | Total packets | Discarded packets |
| A | 0 | 734 | 0 |
| B | 0 | 734 | 0 |
| C | 0 | 734 | 0 |
| D | 0 | 734 | 0 |
| Mode M9 | |||
|---|---|---|---|
| Quadrant | BADHDUFLAG | Total packets | Discarded packets |
| A | 0 | 43 | 0 |
| B | 0 | 43 | 0 |
| C | 0 | 43 | 0 |
| D | 0 | 43 | 0 |
| Quadrant | Total seconds | Saturated seconds | Saturation percentage |
|---|---|---|---|
| A | 36081 | 724 | 2.006596% |
| B | 36081 | 750 | 2.078656% |
| C | 36081 | 6949 | 19.259444% |
| D | 36081 | 3628 | 10.055154% |
Noise dominated data is calculated using 1-second bins in cleaned event files. If a bin has >2000 counts, and if more than 50% of those come from <1% of pixels, then it is considered to be noise-dominated and hence unusable.
| Quadrant | # 1 sec bins | Bins with >0 counts | Bins with >2000 counts | High rate bins dominated by noise | Noise dominated (total time) | Noise dominated (detector-on time) | Marked lightcurve |
|---|---|---|---|---|---|---|---|
| A | 40291 | 36077 | 12 | 12 | 0.03% | 0.03% |  |
| B | 40291 | 36077 | 1 | 1 | 0.00% | 0.00% |  |
| C | 40291 | 36075 | 1485 | 1485 | 3.69% | 4.12% |  |
| D | 40291 | 36080 | 477 | 477 | 1.18% | 1.32% |  |
Top three noisy pixels from each quadrant. If the there are fewer than three noisy pixels in the level2.evt file, extra rows are filled as -1
| Pixel properties | Quadrant properties | ||||||
|---|---|---|---|---|---|---|---|
| Quadrant | DetID | PixID | Counts | Sigma | Mean | Median | Sigma |
| A | 4 | 2 | 240917 | 594.41 | 1817 | 1778 | 402.3 |
| A | 6 | 16 | 153316 | 376.67 | 1817 | 1778 | 402.3 |
| A | 0 | 23 | 59304 | 142.99 | 1817 | 1778 | 402.3 |
| B | 0 | 198 | 68246 | 187.99 | 1841 | 1793 | 353.5 |
| B | 3 | 64 | 44984 | 122.18 | 1841 | 1793 | 353.5 |
| B | 0 | 230 | 32408 | 86.61 | 1841 | 1793 | 353.5 |
| C | 3 | 233 | 18506691 | 47839.48 | 1634 | 1618 | 386.8 |
| C | 7 | 220 | 81183 | 205.69 | 1634 | 1618 | 386.8 |
| C | 10 | 223 | 39113 | 96.93 | 1634 | 1618 | 386.8 |
| D | 7 | 238 | 7914657 | 19396.49 | 1729 | 1659 | 408.0 |
| D | 1 | 52 | 1049791 | 2569.2 | 1729 | 1659 | 408.0 |
| D | 2 | 234 | 134795 | 326.35 | 1729 | 1659 | 408.0 |
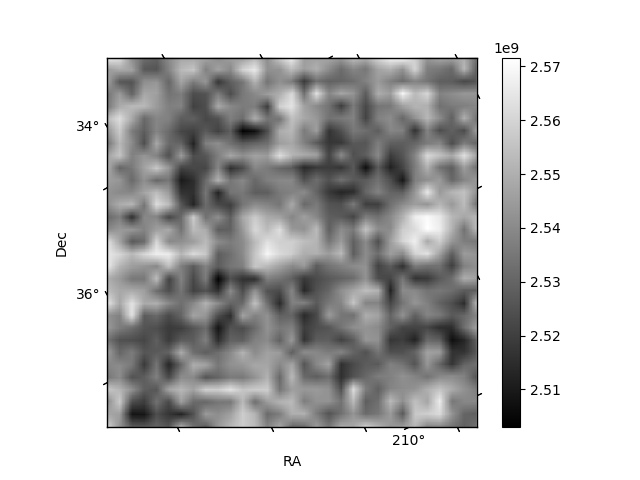
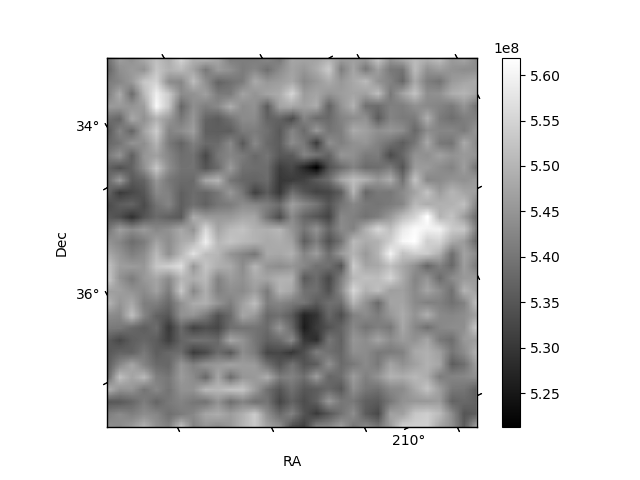
Histogram calculated using DETX and DETY for each event in the final _common_clean file
| Quadrant A |  |
 |
Quadrant B |
|---|---|---|---|
| Quadrant D |  |
 |
Quadrant C |
| Plot type | Count rate plots | Images |
|---|---|---|
| Comparison with Poisson distribution Blue bars denote a histogram of data divided into 1 sec bins. Red curve is a Poisson curve with rate = median count rate of data. |
 |
 |
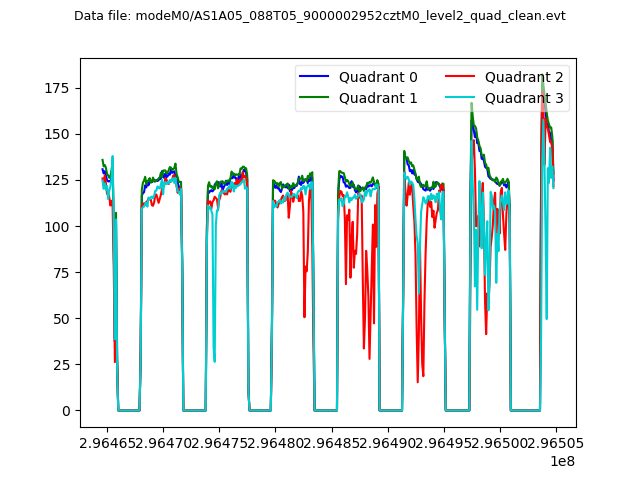
| Quadrant-wise count rates Data is divided into 100 sec bins |
 |
|
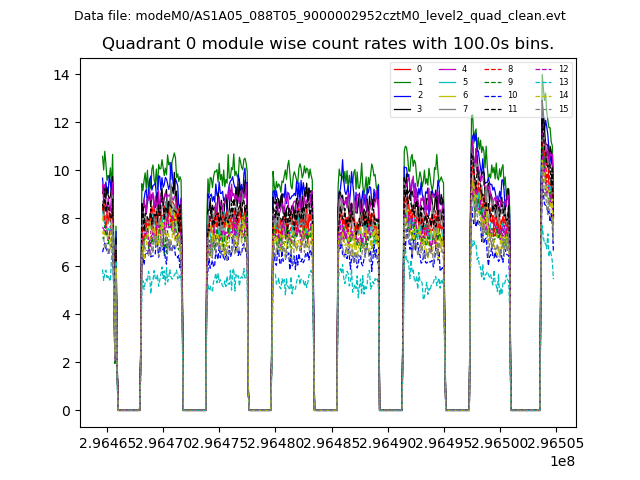
| Module-wise count rates for Quadrant A Data is divided into 100 sec bins |
 |
 |
| Module-wise count rates for Quadrant B Data is divided into 100 sec bins |
 |
 |
| Module-wise count rates for Quadrant C Data is divided into 100 sec bins |
 |
 |
| Module-wise count rates for Quadrant D Data is divided into 100 sec bins |
 |
 |
| Parameter | Plot |
|---|---|
| CZT HV Monitor |  |
| D_VDD |  |
| Temperature 1 | 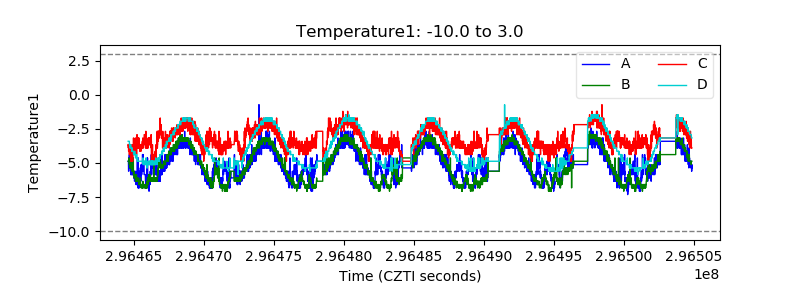 |
| Veto HV Monitor |  |
| Veto LLD |  |
| Alpha Counter | 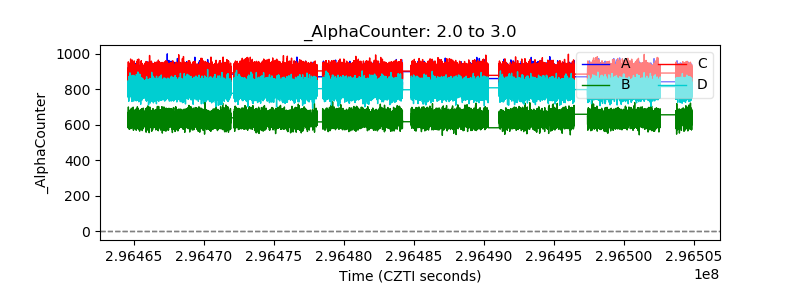 |
| _CPM_Rate |  |
| CZT Counter |  |
| +2.5 Volts monitor | 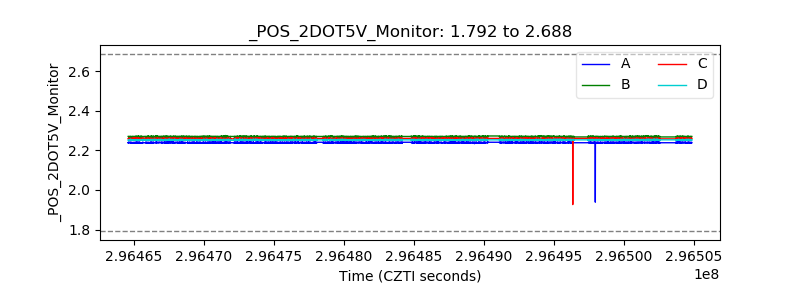 |
| +5 Volts monitor |  |
| _ROLL_ROT |  |
| _Roll_DEC | 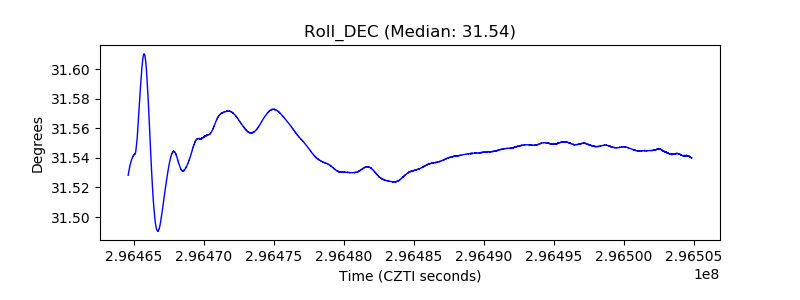 |
| _Roll_RA |  |
| Veto Counter |  |