| Param | Original file | Final file |
|---|---|---|
| Filename | modeM0/AS1C04_009T05_9000002946cztM0_level2_bc.evt | modeM0/AS1C04_009T05_9000002946cztM0_level2_quad_clean.evt |
| Size (bytes) | 209,563,200 | 95,927,040 |
| Size | 199.9 MB | 91.5 MB |
| Events in quadrant A | 1,094,203 | 643,116 |
| Events in quadrant B | 1,227,053 | 649,273 |
| Events in quadrant C | 1,341,320 | 621,811 |
| Events in quadrant D | 2,285,219 | 589,706 |
| Mode SS | |||
|---|---|---|---|
| Quadrant | BADHDUFLAG | Total packets | Discarded packets |
| A | 0 | 118 | 0 |
| B | 0 | 118 | 0 |
| C | 0 | 118 | 0 |
| D | 0 | 118 | 0 |
| Mode M9 | |||
|---|---|---|---|
| Quadrant | BADHDUFLAG | Total packets | Discarded packets |
| A | 0 | 4 | 0 |
| B | 0 | 4 | 0 |
| C | 0 | 4 | 0 |
| D | 0 | 4 | 0 |
| Mode M0 | |||
|---|---|---|---|
| Quadrant | BADHDUFLAG | Total packets | Discarded packets |
| A | 0 | 11652 | 0 |
| B | 0 | 12047 | 0 |
| C | 0 | 12362 | 0 |
| D | 0 | 16275 | 0 |
| Quadrant | Total seconds | Saturated seconds | Saturation percentage |
|---|---|---|---|
| A | 5740 | 69 | 1.202091% |
| B | 5740 | 70 | 1.219512% |
| C | 5740 | 109 | 1.898955% |
| D | 5740 | 453 | 7.891986% |
Noise dominated data is calculated using 1-second bins in cleaned event files. If a bin has >2000 counts, and if more than 50% of those come from <1% of pixels, then it is considered to be noise-dominated and hence unusable.
| Quadrant | # 1 sec bins | Bins with >0 counts | Bins with >2000 counts | High rate bins dominated by noise | Noise dominated (total time) | Noise dominated (detector-on time) | Marked lightcurve |
|---|---|---|---|---|---|---|---|
| A | 5753 | 5739 | 0 | 0 | 0.00% | 0.00% |  |
| B | 5754 | 5740 | 1 | 1 | 0.02% | 0.02% |  |
| C | 5753 | 5739 | 0 | 0 | 0.00% | 0.00% |  |
| D | 5753 | 5739 | 62 | 62 | 1.08% | 1.08% |  |
Top three noisy pixels from each quadrant. If the there are fewer than three noisy pixels in the level2.evt file, extra rows are filled as -1
| Pixel properties | Quadrant properties | ||||||
|---|---|---|---|---|---|---|---|
| Quadrant | DetID | PixID | Counts | Sigma | Mean | Median | Sigma |
| A | 0 | 254 | 6898 | 101.87 | 280 | 274 | 65.0 |
| A | 13 | 254 | 5539 | 80.97 | 280 | 274 | 65.0 |
| A | 8 | 205 | 3411 | 48.25 | 280 | 274 | 65.0 |
| B | 4 | 216 | 39052 | 676.73 | 282 | 274 | 57.3 |
| B | 7 | 220 | 29204 | 504.87 | 282 | 274 | 57.3 |
| B | 4 | 171 | 29172 | 504.31 | 282 | 274 | 57.3 |
| C | 3 | 233 | 286536 | 4326.36 | 269 | 266 | 66.2 |
| C | 7 | 247 | 18701 | 278.61 | 269 | 266 | 66.2 |
| C | 13 | 61 | 1563 | 19.6 | 269 | 266 | 66.2 |
| D | 1 | 52 | 720727 | 11127.46 | 266 | 255 | 64.7 |
| D | 7 | 238 | 391432 | 6041.6 | 266 | 255 | 64.7 |
| D | 12 | 218 | 94173 | 1450.53 | 266 | 255 | 64.7 |
Histogram calculated using DETX and DETY for each event in the final _common_clean file
| Quadrant A |  |
 |
Quadrant B |
|---|---|---|---|
| Quadrant D |  |
 |
Quadrant C |
| Plot type | Count rate plots | Images |
|---|---|---|
| Comparison with Poisson distribution Blue bars denote a histogram of data divided into 1 sec bins. Red curve is a Poisson curve with rate = median count rate of data. |
 |
 |
| Quadrant-wise count rates Data is divided into 100 sec bins |
 |
|
| Module-wise count rates for Quadrant A Data is divided into 100 sec bins |
 |
 |
| Module-wise count rates for Quadrant B Data is divided into 100 sec bins |
 |
 |
| Module-wise count rates for Quadrant C Data is divided into 100 sec bins |
 |
 |
| Module-wise count rates for Quadrant D Data is divided into 100 sec bins |
 |
 |
| Parameter | Plot |
|---|---|
| CZT HV Monitor |  |
| D_VDD |  |
| Temperature 1 |  |
| Veto HV Monitor |  |
| Veto LLD |  |
| Alpha Counter |  |
| _CPM_Rate |  |
| CZT Counter |  |
| +2.5 Volts monitor |  |
| +5 Volts monitor |  |
| _ROLL_ROT | 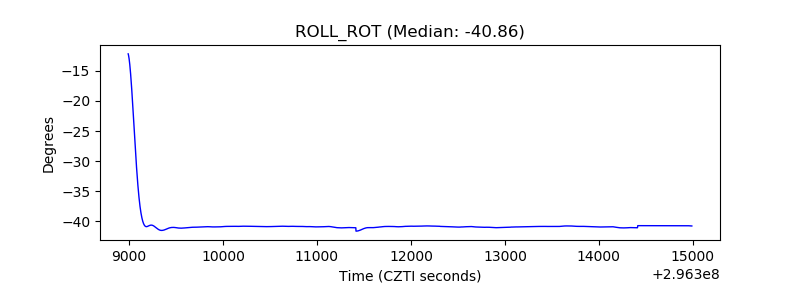 |
| _Roll_DEC |  |
| _Roll_RA |  |
| Veto Counter |  |