| Param | Original file | Final file |
|---|---|---|
| Filename | modeM0/AS1C04_001T01_9000002948cztM0_level2_bc.evt | modeM0/AS1C04_001T01_9000002948cztM0_level2_quad_clean.evt |
| Size (bytes) | 3,723,312,960 | 1,650,893,760 |
| Size | 3.5 GB | 1.5 GB |
| Events in quadrant A | 20,693,213 | 11,062,507 |
| Events in quadrant B | 20,799,604 | 11,342,030 |
| Events in quadrant C | 28,259,583 | 10,901,241 |
| Events in quadrant D | 36,742,780 | 10,393,237 |
| Mode M9 | |||
|---|---|---|---|
| Quadrant | BADHDUFLAG | Total packets | Discarded packets |
| A | 0 | 154 | 0 |
| B | 0 | 154 | 0 |
| C | 0 | 154 | 0 |
| D | 0 | 154 | 0 |
| Mode SS | |||
|---|---|---|---|
| Quadrant | BADHDUFLAG | Total packets | Discarded packets |
| A | 0 | 1868 | 0 |
| B | 0 | 1868 | 0 |
| C | 0 | 1868 | 0 |
| D | 0 | 1868 | 0 |
| Mode M0 | |||
|---|---|---|---|
| Quadrant | BADHDUFLAG | Total packets | Discarded packets |
| A | 0 | 195091 | 0 |
| B | 0 | 197616 | 0 |
| C | 0 | 219958 | 0 |
| D | 0 | 253947 | 0 |
| Quadrant | Total seconds | Saturated seconds | Saturation percentage |
|---|---|---|---|
| A | 92047 | 1700 | 1.846883% |
| B | 92047 | 1351 | 1.467728% |
| C | 92047 | 3063 | 3.327648% |
| D | 92047 | 5417 | 5.885037% |
Noise dominated data is calculated using 1-second bins in cleaned event files. If a bin has >2000 counts, and if more than 50% of those come from <1% of pixels, then it is considered to be noise-dominated and hence unusable.
| Quadrant | # 1 sec bins | Bins with >0 counts | Bins with >2000 counts | High rate bins dominated by noise | Noise dominated (total time) | Noise dominated (detector-on time) | Marked lightcurve |
|---|---|---|---|---|---|---|---|
| A | 107126 | 92044 | 374 | 374 | 0.35% | 0.41% | 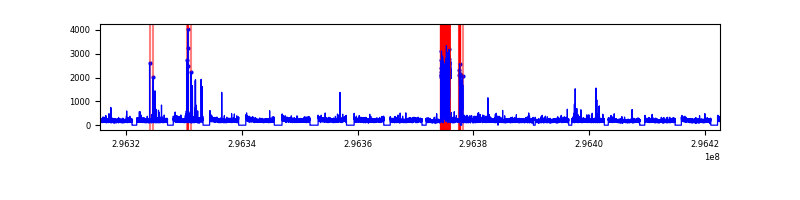 |
| B | 107126 | 92043 | 44 | 44 | 0.04% | 0.05% |  |
| C | 107126 | 92044 | 295 | 295 | 0.28% | 0.32% |  |
| D | 107126 | 92046 | 1233 | 1233 | 1.15% | 1.34% |  |
Top three noisy pixels from each quadrant. If the there are fewer than three noisy pixels in the level2.evt file, extra rows are filled as -1
| Pixel properties | Quadrant properties | ||||||
|---|---|---|---|---|---|---|---|
| Quadrant | DetID | PixID | Counts | Sigma | Mean | Median | Sigma |
| A | 0 | 23 | 1969289 | 1921.62 | 4699 | 4620 | 1022.4 |
| A | 11 | 29 | 162032 | 153.96 | 4699 | 4620 | 1022.4 |
| A | 5 | 16 | 147285 | 139.54 | 4699 | 4620 | 1022.4 |
| B | 7 | 220 | 887505 | 982.73 | 4790 | 4674 | 898.3 |
| B | 3 | 64 | 317487 | 348.21 | 4790 | 4674 | 898.3 |
| B | 4 | 216 | 278846 | 305.2 | 4790 | 4674 | 898.3 |
| C | 3 | 233 | 10055071 | 9258.49 | 4597 | 4582 | 1085.5 |
| C | 7 | 247 | 286549 | 259.75 | 4597 | 4582 | 1085.5 |
| C | 3 | 247 | 80042 | 69.51 | 4597 | 4582 | 1085.5 |
| D | 1 | 52 | 13645035 | 12602.36 | 4588 | 4427 | 1082.4 |
| D | 7 | 238 | 1343068 | 1236.75 | 4588 | 4427 | 1082.4 |
| D | 9 | 1 | 913110 | 839.52 | 4588 | 4427 | 1082.4 |
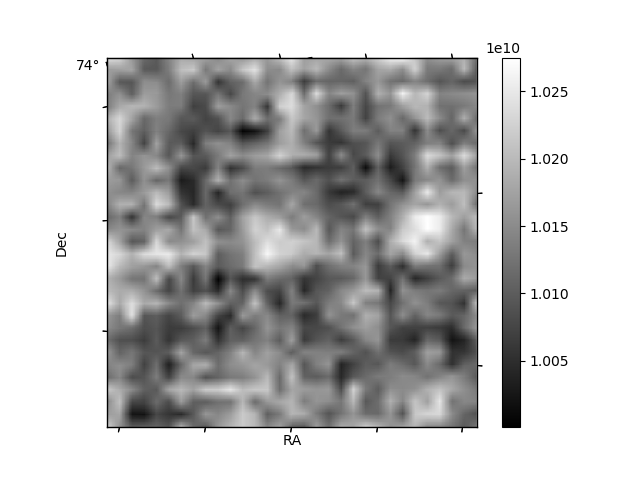
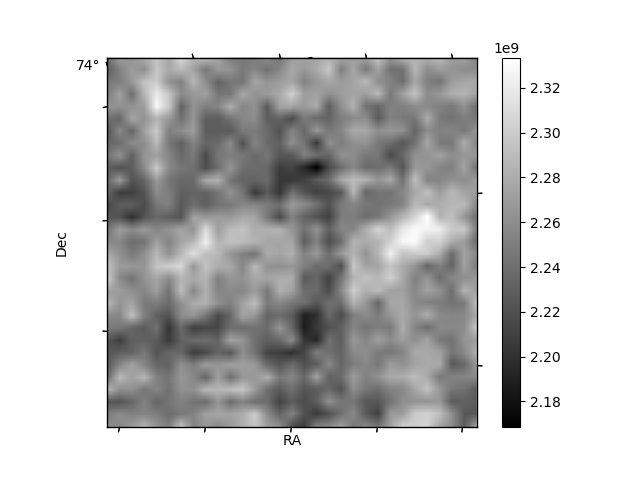
Histogram calculated using DETX and DETY for each event in the final _common_clean file
| Quadrant A |  |
 |
Quadrant B |
|---|---|---|---|
| Quadrant D |  |
 |
Quadrant C |
| Plot type | Count rate plots | Images |
|---|---|---|
| Comparison with Poisson distribution Blue bars denote a histogram of data divided into 1 sec bins. Red curve is a Poisson curve with rate = median count rate of data. |
 |
 |
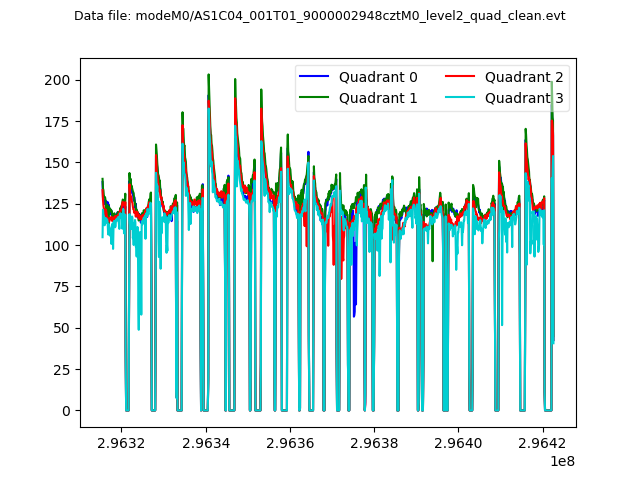
| Quadrant-wise count rates Data is divided into 100 sec bins |
 |
|
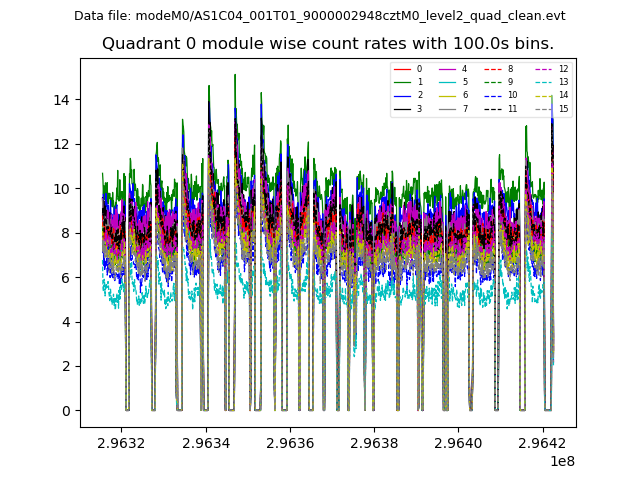
| Module-wise count rates for Quadrant A Data is divided into 100 sec bins |
 |
 |
| Module-wise count rates for Quadrant B Data is divided into 100 sec bins |
 |
 |
| Module-wise count rates for Quadrant C Data is divided into 100 sec bins |
 |
 |
| Module-wise count rates for Quadrant D Data is divided into 100 sec bins |
 |
 |
| Parameter | Plot |
|---|---|
| CZT HV Monitor |  |
| D_VDD | 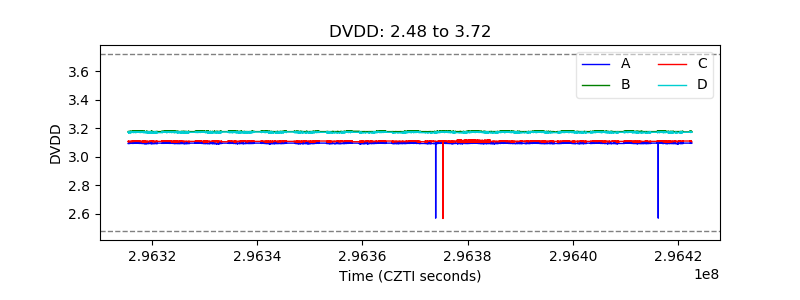 |
| Temperature 1 |  |
| Veto HV Monitor |  |
| Veto LLD |  |
| Alpha Counter |  |
| _CPM_Rate |  |
| CZT Counter |  |
| +2.5 Volts monitor | 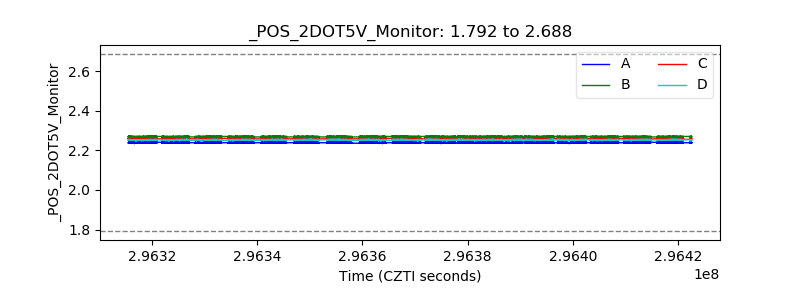 |
| +5 Volts monitor | 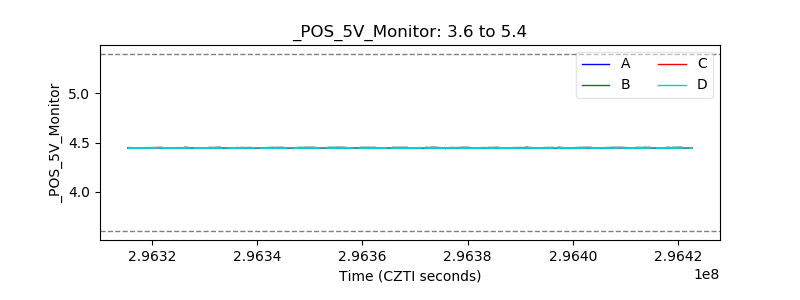 |
| _ROLL_ROT |  |
| _Roll_DEC |  |
| _Roll_RA |  |
| Veto Counter |  |