| Param | Original file | Final file |
|---|---|---|
| Filename | modeM0/AS1A05_176T04_9000002942cztM0_level2_bc.evt | modeM0/AS1A05_176T04_9000002942cztM0_level2_quad_clean.evt |
| Size (bytes) | 310,708,800 | 129,346,560 |
| Size | 296.3 MB | 123.4 MB |
| Events in quadrant A | 1,861,790 | 833,898 |
| Events in quadrant B | 1,977,878 | 841,196 |
| Events in quadrant C | 1,934,833 | 819,156 |
| Events in quadrant D | 2,989,009 | 773,371 |
| Mode M9 | |||
|---|---|---|---|
| Quadrant | BADHDUFLAG | Total packets | Discarded packets |
| A | 0 | 16 | 0 |
| B | 0 | 16 | 0 |
| C | 0 | 16 | 0 |
| D | 0 | 16 | 0 |
| Mode M0 | |||
|---|---|---|---|
| Quadrant | BADHDUFLAG | Total packets | Discarded packets |
| A | 0 | 19236 | 0 |
| B | 0 | 19732 | 0 |
| C | 0 | 19759 | 0 |
| D | 0 | 23529 | 0 |
| Mode SS | |||
|---|---|---|---|
| Quadrant | BADHDUFLAG | Total packets | Discarded packets |
| A | 0 | 192 | 0 |
| B | 0 | 192 | 0 |
| C | 0 | 192 | 0 |
| D | 0 | 192 | 0 |
| Quadrant | Total seconds | Saturated seconds | Saturation percentage |
|---|---|---|---|
| A | 9366 | 48 | 0.512492% |
| B | 9366 | 82 | 0.875507% |
| C | 9366 | 115 | 1.227845% |
| D | 9366 | 480 | 5.124920% |
Noise dominated data is calculated using 1-second bins in cleaned event files. If a bin has >2000 counts, and if more than 50% of those come from <1% of pixels, then it is considered to be noise-dominated and hence unusable.
| Quadrant | # 1 sec bins | Bins with >0 counts | Bins with >2000 counts | High rate bins dominated by noise | Noise dominated (total time) | Noise dominated (detector-on time) | Marked lightcurve |
|---|---|---|---|---|---|---|---|
| A | 10996 | 9366 | 2 | 2 | 0.02% | 0.02% |  |
| B | 10996 | 9366 | 11 | 11 | 0.10% | 0.12% | 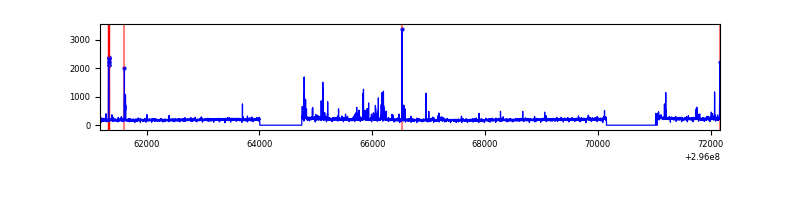 |
| C | 10996 | 9367 | 0 | 0 | 0.00% | 0.00% |  |
| D | 10996 | 9366 | 178 | 178 | 1.62% | 1.90% |  |
Top three noisy pixels from each quadrant. If the there are fewer than three noisy pixels in the level2.evt file, extra rows are filled as -1
| Pixel properties | Quadrant properties | ||||||
|---|---|---|---|---|---|---|---|
| Quadrant | DetID | PixID | Counts | Sigma | Mean | Median | Sigma |
| A | 5 | 16 | 40905 | 389.78 | 466 | 456 | 103.8 |
| A | 11 | 47 | 23801 | 224.96 | 466 | 456 | 103.8 |
| A | 13 | 254 | 6869 | 61.8 | 466 | 456 | 103.8 |
| B | 7 | 220 | 42301 | 452.18 | 468 | 456 | 92.5 |
| B | 3 | 64 | 39211 | 418.79 | 468 | 456 | 92.5 |
| B | 0 | 230 | 24703 | 262.02 | 468 | 456 | 92.5 |
| C | 3 | 233 | 146873 | 1319.08 | 454 | 450 | 111.0 |
| C | 8 | 208 | 25299 | 223.86 | 454 | 450 | 111.0 |
| C | 9 | 221 | 8181 | 69.65 | 454 | 450 | 111.0 |
| D | 7 | 238 | 971806 | 8988.19 | 452 | 435 | 108.1 |
| D | 1 | 52 | 121074 | 1116.28 | 452 | 435 | 108.1 |
| D | 2 | 16 | 72751 | 669.15 | 452 | 435 | 108.1 |
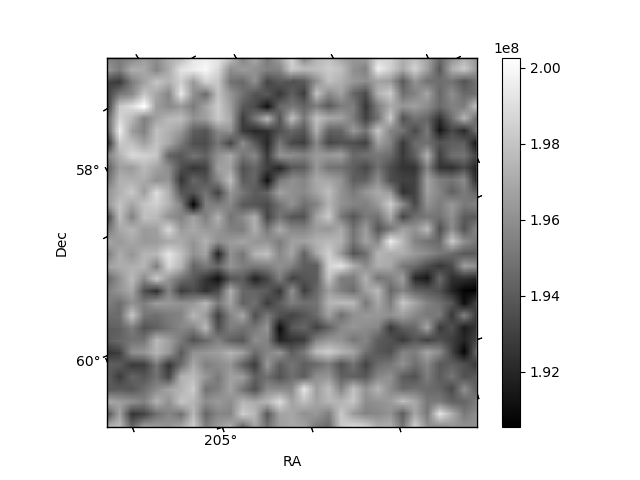
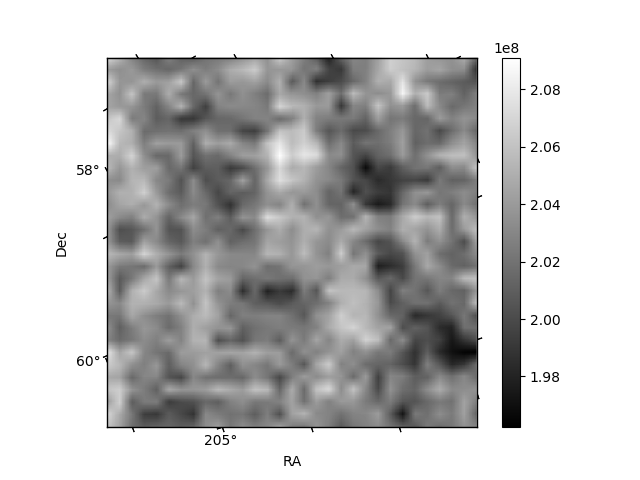
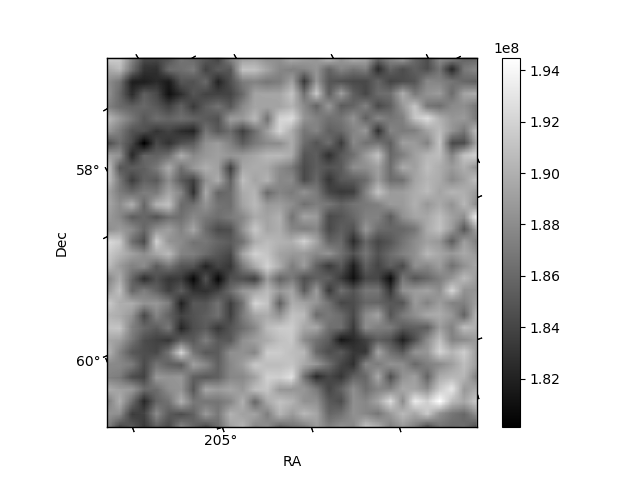
Histogram calculated using DETX and DETY for each event in the final _common_clean file
| Quadrant A |  |
 |
Quadrant B |
|---|---|---|---|
| Quadrant D |  |
 |
Quadrant C |
| Plot type | Count rate plots | Images |
|---|---|---|
| Comparison with Poisson distribution Blue bars denote a histogram of data divided into 1 sec bins. Red curve is a Poisson curve with rate = median count rate of data. |
 |
 |
| Quadrant-wise count rates Data is divided into 100 sec bins |
 |
|
| Module-wise count rates for Quadrant A Data is divided into 100 sec bins |
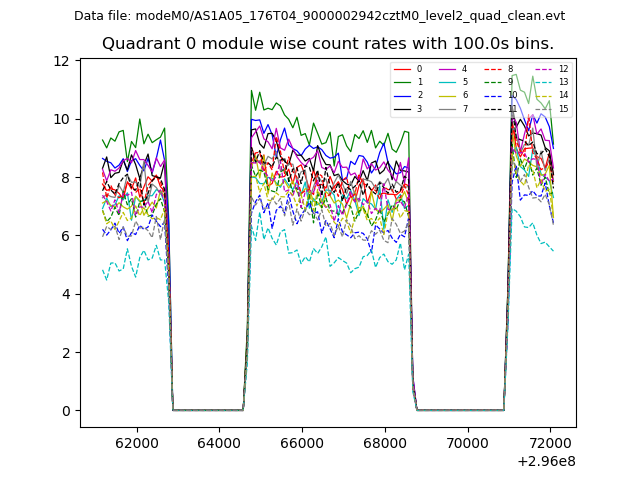 |
 |
| Module-wise count rates for Quadrant B Data is divided into 100 sec bins |
 |
 |
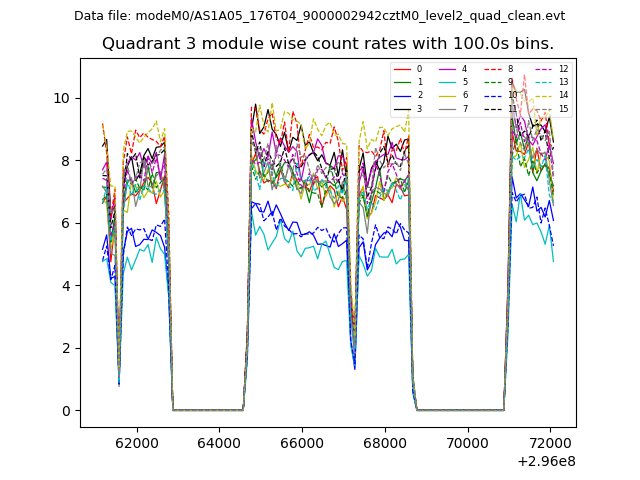
| Module-wise count rates for Quadrant C Data is divided into 100 sec bins |
 |
 |
| Module-wise count rates for Quadrant D Data is divided into 100 sec bins |
 |
 |
| Parameter | Plot |
|---|---|
| CZT HV Monitor | 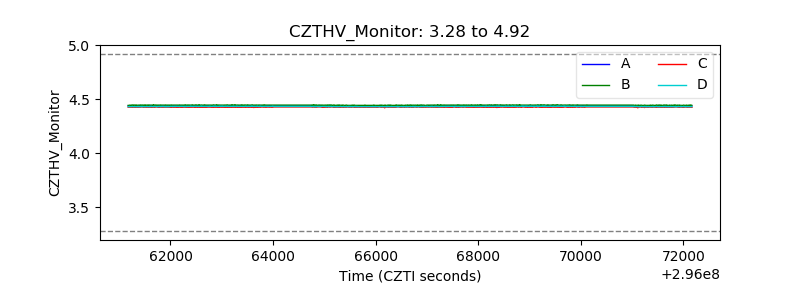 |
| D_VDD |  |
| Temperature 1 |  |
| Veto HV Monitor |  |
| Veto LLD |  |
| Alpha Counter |  |
| _CPM_Rate |  |
| CZT Counter |  |
| +2.5 Volts monitor |  |
| +5 Volts monitor | 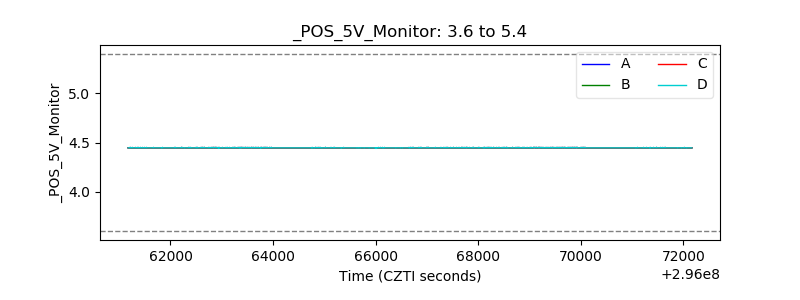 |
| _ROLL_ROT | 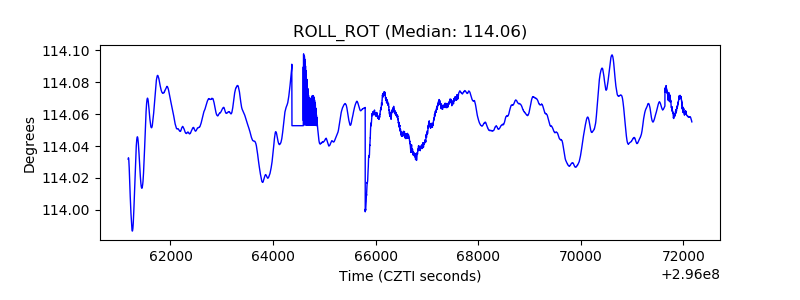 |
| _Roll_DEC |  |
| _Roll_RA | 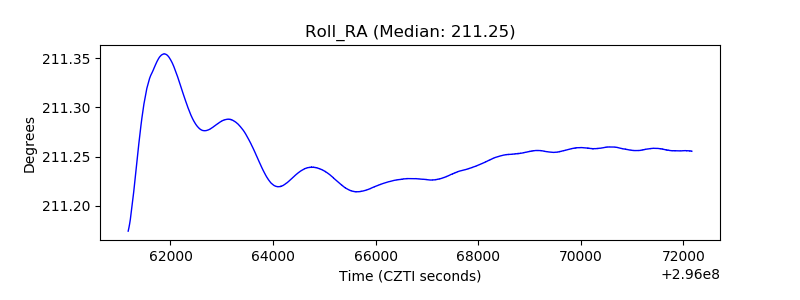 |
| Veto Counter |  |