| Param | Original file | Final file |
|---|---|---|
| Filename | modeM0/AS1A05_075T03_9000002940cztM0_level2_bc.evt | modeM0/AS1A05_075T03_9000002940cztM0_level2_quad_clean.evt |
| Size (bytes) | 490,717,440 | 190,788,480 |
| Size | 468.0 MB | 182.0 MB |
| Events in quadrant A | 2,888,848 | 1,238,494 |
| Events in quadrant B | 2,972,844 | 1,246,922 |
| Events in quadrant C | 2,782,515 | 1,191,675 |
| Events in quadrant D | 5,263,314 | 1,142,128 |
| Mode M0 | |||
|---|---|---|---|
| Quadrant | BADHDUFLAG | Total packets | Discarded packets |
| A | 0 | 28957 | 0 |
| B | 0 | 29093 | 0 |
| C | 0 | 28550 | 0 |
| D | 0 | 37400 | 0 |
| Mode M9 | |||
|---|---|---|---|
| Quadrant | BADHDUFLAG | Total packets | Discarded packets |
| A | 0 | 8 | 0 |
| B | 0 | 8 | 0 |
| C | 0 | 8 | 0 |
| D | 0 | 8 | 0 |
| Mode SS | |||
|---|---|---|---|
| Quadrant | BADHDUFLAG | Total packets | Discarded packets |
| A | 0 | 284 | 0 |
| B | 0 | 284 | 0 |
| C | 0 | 284 | 0 |
| D | 0 | 284 | 0 |
| Quadrant | Total seconds | Saturated seconds | Saturation percentage |
|---|---|---|---|
| A | 13892 | 183 | 1.317305% |
| B | 13892 | 216 | 1.554852% |
| C | 13892 | 240 | 1.727613% |
| D | 13892 | 868 | 6.248200% |
Noise dominated data is calculated using 1-second bins in cleaned event files. If a bin has >2000 counts, and if more than 50% of those come from <1% of pixels, then it is considered to be noise-dominated and hence unusable.
| Quadrant | # 1 sec bins | Bins with >0 counts | Bins with >2000 counts | High rate bins dominated by noise | Noise dominated (total time) | Noise dominated (detector-on time) | Marked lightcurve |
|---|---|---|---|---|---|---|---|
| A | 14667 | 13891 | 1 | 1 | 0.01% | 0.01% |  |
| B | 14667 | 13892 | 3 | 3 | 0.02% | 0.02% |  |
| C | 14667 | 13892 | 0 | 0 | 0.00% | 0.00% |  |
| D | 14667 | 13891 | 78 | 78 | 0.53% | 0.56% |  |
Top three noisy pixels from each quadrant. If the there are fewer than three noisy pixels in the level2.evt file, extra rows are filled as -1
| Pixel properties | Quadrant properties | ||||||
|---|---|---|---|---|---|---|---|
| Quadrant | DetID | PixID | Counts | Sigma | Mean | Median | Sigma |
| A | 5 | 16 | 222841 | 1441.15 | 684 | 669 | 154.2 |
| A | 13 | 210 | 24122 | 152.13 | 684 | 669 | 154.2 |
| A | 13 | 254 | 7463 | 44.07 | 684 | 669 | 154.2 |
| B | 7 | 220 | 83855 | 619.03 | 689 | 671 | 134.4 |
| B | 4 | 216 | 51718 | 379.87 | 689 | 671 | 134.4 |
| B | 0 | 198 | 42983 | 314.87 | 689 | 671 | 134.4 |
| C | 3 | 233 | 183616 | 1150.81 | 659 | 652 | 159.0 |
| C | 7 | 247 | 42431 | 262.78 | 659 | 652 | 159.0 |
| C | 8 | 208 | 8336 | 48.33 | 659 | 652 | 159.0 |
| D | 7 | 238 | 1316250 | 8357.13 | 660 | 636 | 157.4 |
| D | 1 | 52 | 895852 | 5686.65 | 660 | 636 | 157.4 |
| D | 1 | 20 | 193614 | 1225.85 | 660 | 636 | 157.4 |
Histogram calculated using DETX and DETY for each event in the final _common_clean file
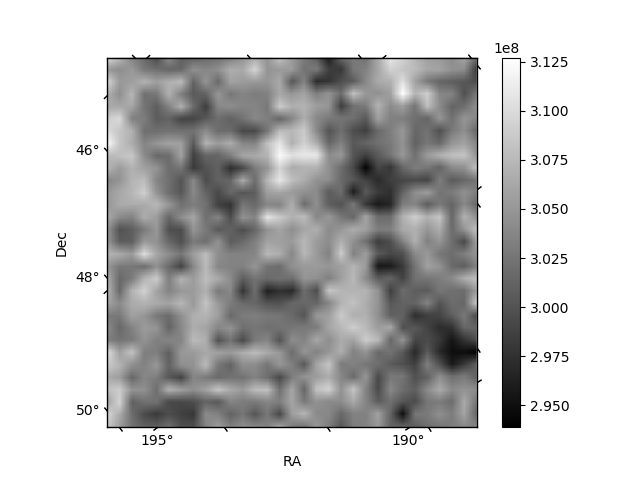
| Quadrant A |  |
 |
Quadrant B |
|---|---|---|---|
| Quadrant D |  |
 |
Quadrant C |
| Plot type | Count rate plots | Images |
|---|---|---|
| Comparison with Poisson distribution Blue bars denote a histogram of data divided into 1 sec bins. Red curve is a Poisson curve with rate = median count rate of data. |
 |
 |
| Quadrant-wise count rates Data is divided into 100 sec bins |
 |
|
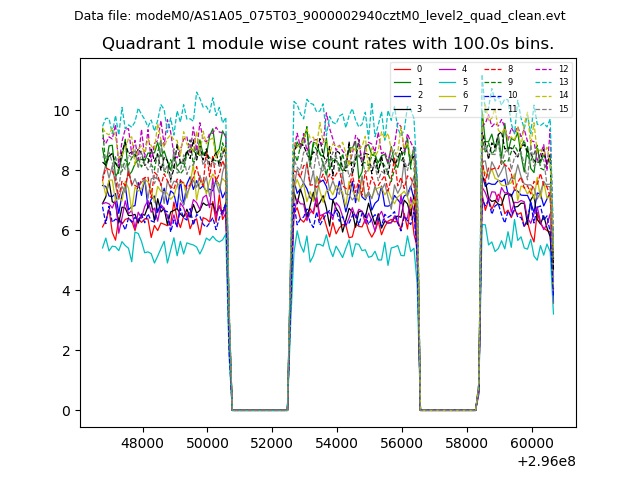
| Module-wise count rates for Quadrant A Data is divided into 100 sec bins |
 |
 |
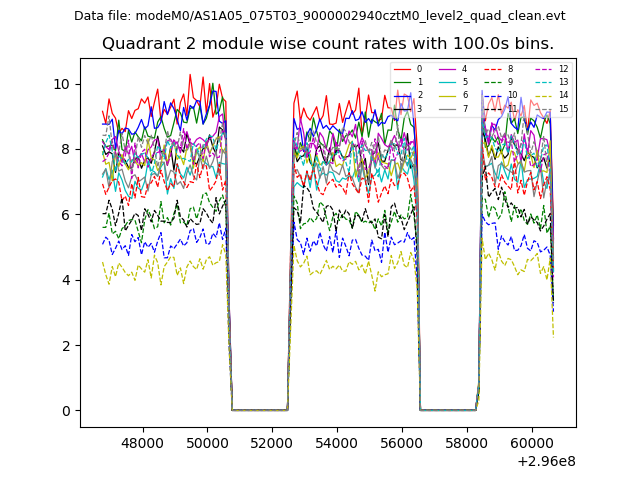
| Module-wise count rates for Quadrant B Data is divided into 100 sec bins |
 |
 |
| Module-wise count rates for Quadrant C Data is divided into 100 sec bins |
 |
 |
| Module-wise count rates for Quadrant D Data is divided into 100 sec bins |
 |
 |
| Parameter | Plot |
|---|---|
| CZT HV Monitor |  |
| D_VDD | 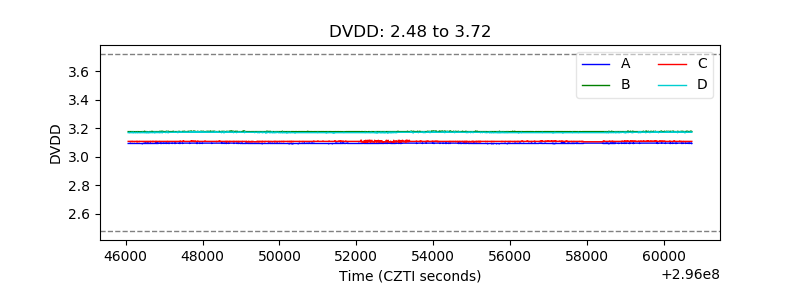 |
| Temperature 1 |  |
| Veto HV Monitor |  |
| Veto LLD |  |
| Alpha Counter |  |
| _CPM_Rate |  |
| CZT Counter | 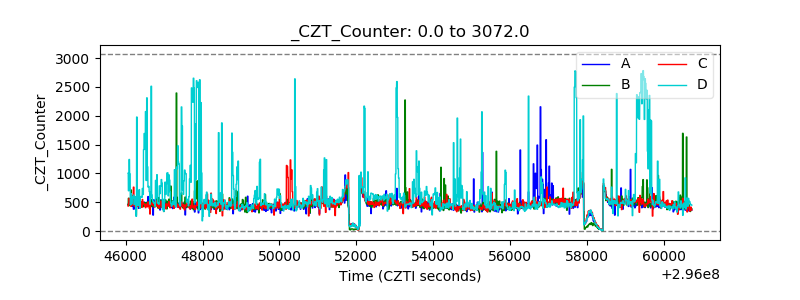 |
| +2.5 Volts monitor | 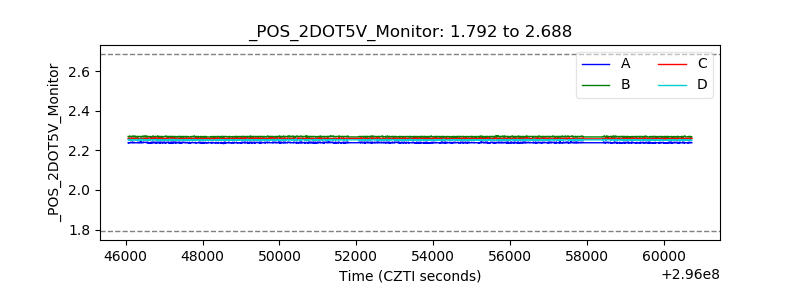 |
| +5 Volts monitor |  |
| _ROLL_ROT |  |
| _Roll_DEC |  |
| _Roll_RA |  |
| Veto Counter | 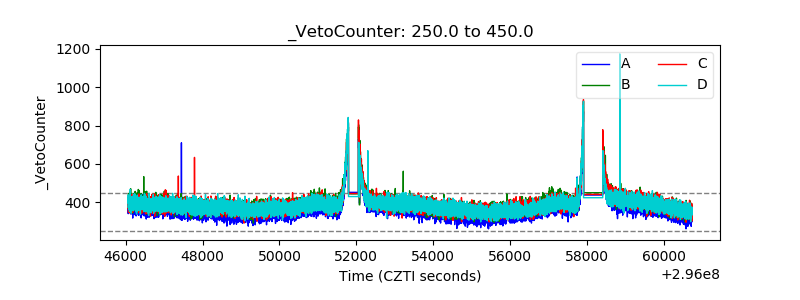 |