| Param | Original file | Final file |
|---|---|---|
| Filename | modeM0/AS1A05_013T01_9000002944cztM0_level2_bc.evt | modeM0/AS1A05_013T01_9000002944cztM0_level2_quad_clean.evt |
| Size (bytes) | 7,264,428,480 | 2,566,592,640 |
| Size | 6.8 GB | 2.4 GB |
| Events in quadrant A | 42,969,948 | 16,327,741 |
| Events in quadrant B | 46,592,669 | 16,648,882 |
| Events in quadrant C | 52,058,858 | 15,739,811 |
| Events in quadrant D | 64,657,682 | 15,216,030 |
| Mode SS | |||
|---|---|---|---|
| Quadrant | BADHDUFLAG | Total packets | Discarded packets |
| A | 0 | 4106 | 0 |
| B | 0 | 4106 | 0 |
| C | 0 | 4106 | 0 |
| D | 0 | 4106 | 0 |
| Mode M0 | |||
|---|---|---|---|
| Quadrant | BADHDUFLAG | Total packets | Discarded packets |
| A | 0 | 419866 | 0 |
| B | 0 | 432985 | 0 |
| C | 0 | 455216 | 0 |
| D | 0 | 489199 | 0 |
| Mode M9 | |||
|---|---|---|---|
| Quadrant | BADHDUFLAG | Total packets | Discarded packets |
| A | 0 | 309 | 0 |
| B | 0 | 310 | 0 |
| C | 0 | 311 | 0 |
| D | 0 | 311 | 0 |
| Quadrant | Total seconds | Saturated seconds | Saturation percentage |
|---|---|---|---|
| A | 201614 | 2766 | 1.371929% |
| B | 201614 | 3528 | 1.749878% |
| C | 201613 | 4838 | 2.399647% |
| D | 201613 | 6785 | 3.365358% |
Noise dominated data is calculated using 1-second bins in cleaned event files. If a bin has >2000 counts, and if more than 50% of those come from <1% of pixels, then it is considered to be noise-dominated and hence unusable.
| Quadrant | # 1 sec bins | Bins with >0 counts | Bins with >2000 counts | High rate bins dominated by noise | Noise dominated (total time) | Noise dominated (detector-on time) | Marked lightcurve |
|---|---|---|---|---|---|---|---|
| A | 234119 | 201607 | 41 | 41 | 0.02% | 0.02% |  |
| B | 234119 | 201603 | 86 | 86 | 0.04% | 0.04% |  |
| C | 234119 | 201598 | 23 | 23 | 0.01% | 0.01% | 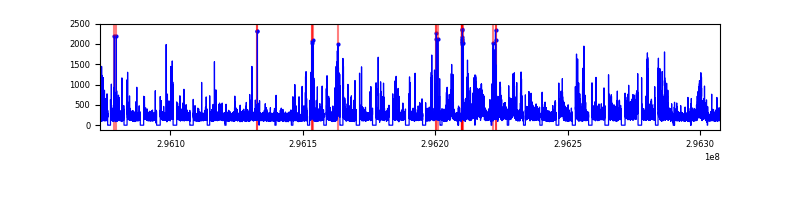 |
| D | 234119 | 201601 | 1411 | 1411 | 0.60% | 0.70% | 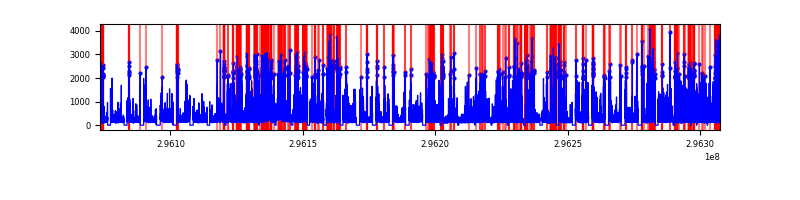 |
Top three noisy pixels from each quadrant. If the there are fewer than three noisy pixels in the level2.evt file, extra rows are filled as -1
| Pixel properties | Quadrant properties | ||||||
|---|---|---|---|---|---|---|---|
| Quadrant | DetID | PixID | Counts | Sigma | Mean | Median | Sigma |
| A | 5 | 16 | 528555 | 222.53 | 10727 | 10543 | 2327.9 |
| A | 10 | 1 | 358440 | 149.45 | 10727 | 10543 | 2327.9 |
| A | 0 | 254 | 271832 | 112.24 | 10727 | 10543 | 2327.9 |
| B | 7 | 220 | 895356 | 430.41 | 10890 | 10618 | 2055.6 |
| B | 4 | 216 | 782288 | 375.4 | 10890 | 10618 | 2055.6 |
| B | 3 | 64 | 670810 | 321.17 | 10890 | 10618 | 2055.6 |
| C | 3 | 233 | 11297180 | 4682.14 | 10300 | 10240 | 2410.6 |
| C | 7 | 247 | 823615 | 337.41 | 10300 | 10240 | 2410.6 |
| C | 9 | 221 | 140867 | 54.19 | 10300 | 10240 | 2410.6 |
| D | 1 | 52 | 16224773 | 6763.96 | 10428 | 10076 | 2397.2 |
| D | 2 | 16 | 2012537 | 835.33 | 10428 | 10076 | 2397.2 |
| D | 12 | 218 | 1704329 | 706.76 | 10428 | 10076 | 2397.2 |
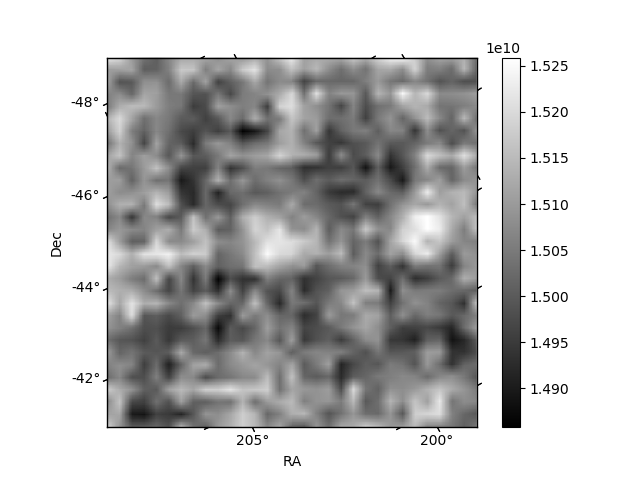
Histogram calculated using DETX and DETY for each event in the final _common_clean file
| Quadrant A |  |
 |
Quadrant B |
|---|---|---|---|
| Quadrant D |  |
 |
Quadrant C |
| Plot type | Count rate plots | Images |
|---|---|---|
| Comparison with Poisson distribution Blue bars denote a histogram of data divided into 1 sec bins. Red curve is a Poisson curve with rate = median count rate of data. |
 |
 |
| Quadrant-wise count rates Data is divided into 100 sec bins |
 |
|
| Module-wise count rates for Quadrant A Data is divided into 100 sec bins |
 |
 |
| Module-wise count rates for Quadrant B Data is divided into 100 sec bins |
 |
 |
| Module-wise count rates for Quadrant C Data is divided into 100 sec bins |
 |
 |
| Module-wise count rates for Quadrant D Data is divided into 100 sec bins |
 |
 |
| Parameter | Plot |
|---|---|
| CZT HV Monitor |  |
| D_VDD |  |
| Temperature 1 |  |
| Veto HV Monitor |  |
| Veto LLD |  |
| Alpha Counter | 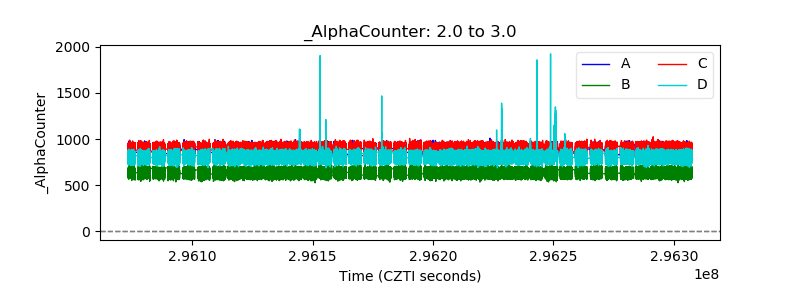 |
| _CPM_Rate |  |
| CZT Counter |  |
| +2.5 Volts monitor |  |
| +5 Volts monitor | 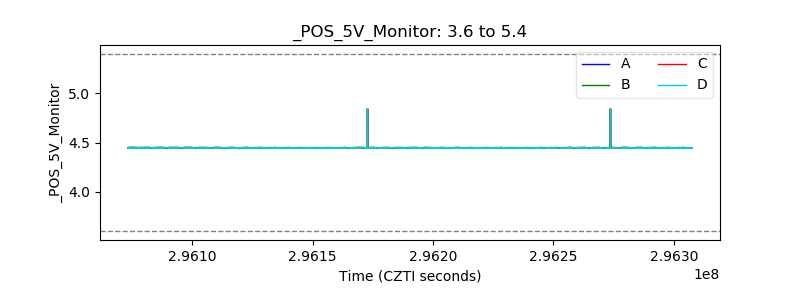 |
| _ROLL_ROT |  |
| _Roll_DEC | 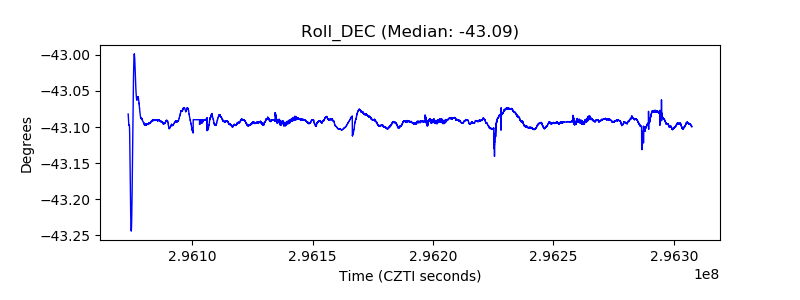 |
| _Roll_RA |  |
| Veto Counter |  |