| Param | Original file | Final file |
|---|---|---|
| Filename | modeM0/AS1T03_037T01_9000002930cztM0_level2_bc.evt | modeM0/AS1T03_037T01_9000002930cztM0_level2_quad_clean.evt |
| Size (bytes) | 992,211,840 | 413,723,520 |
| Size | 946.2 MB | 394.6 MB |
| Events in quadrant A | 6,173,164 | 2,689,052 |
| Events in quadrant B | 7,278,721 | 2,740,131 |
| Events in quadrant C | 6,406,656 | 2,650,855 |
| Events in quadrant D | 8,328,399 | 2,577,561 |
| Mode M0 | |||
|---|---|---|---|
| Quadrant | BADHDUFLAG | Total packets | Discarded packets |
| A | 0 | 57079 | 0 |
| B | 0 | 61322 | 0 |
| C | 0 | 58406 | 0 |
| D | 0 | 64488 | 0 |
| Mode M9 | |||
|---|---|---|---|
| Quadrant | BADHDUFLAG | Total packets | Discarded packets |
| A | 0 | 53 | 0 |
| B | 0 | 53 | 0 |
| C | 0 | 53 | 0 |
| D | 0 | 53 | 0 |
| Mode SS | |||
|---|---|---|---|
| Quadrant | BADHDUFLAG | Total packets | Discarded packets |
| A | 0 | 556 | 0 |
| B | 0 | 556 | 0 |
| C | 0 | 556 | 0 |
| D | 0 | 556 | 0 |
| Quadrant | Total seconds | Saturated seconds | Saturation percentage |
|---|---|---|---|
| A | 27250 | 323 | 1.185321% |
| B | 27250 | 592 | 2.172477% |
| C | 27250 | 498 | 1.827523% |
| D | 27250 | 669 | 2.455046% |
Noise dominated data is calculated using 1-second bins in cleaned event files. If a bin has >2000 counts, and if more than 50% of those come from <1% of pixels, then it is considered to be noise-dominated and hence unusable.
| Quadrant | # 1 sec bins | Bins with >0 counts | Bins with >2000 counts | High rate bins dominated by noise | Noise dominated (total time) | Noise dominated (detector-on time) | Marked lightcurve |
|---|---|---|---|---|---|---|---|
| A | 32595 | 27251 | 20 | 20 | 0.06% | 0.07% | 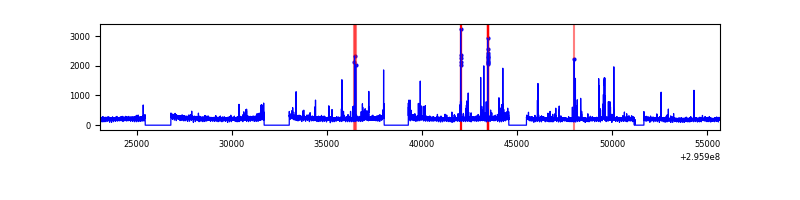 |
| B | 32595 | 27249 | 26 | 26 | 0.08% | 0.10% |  |
| C | 32595 | 27245 | 0 | 0 | 0.00% | 0.00% |  |
| D | 32595 | 27248 | 86 | 86 | 0.26% | 0.32% |  |
Top three noisy pixels from each quadrant. If the there are fewer than three noisy pixels in the level2.evt file, extra rows are filled as -1
| Pixel properties | Quadrant properties | ||||||
|---|---|---|---|---|---|---|---|
| Quadrant | DetID | PixID | Counts | Sigma | Mean | Median | Sigma |
| A | 5 | 16 | 296567 | 932.39 | 1478 | 1455 | 316.5 |
| A | 11 | 29 | 162335 | 508.29 | 1478 | 1455 | 316.5 |
| A | 13 | 254 | 18569 | 54.07 | 1478 | 1455 | 316.5 |
| B | 3 | 112 | 946852 | 3370.2 | 1498 | 1463 | 280.5 |
| B | 0 | 198 | 170152 | 601.36 | 1498 | 1463 | 280.5 |
| B | 4 | 216 | 101404 | 356.28 | 1498 | 1463 | 280.5 |
| C | 3 | 233 | 537355 | 1566.71 | 1455 | 1452 | 342.1 |
| C | 9 | 221 | 231182 | 671.62 | 1455 | 1452 | 342.1 |
| C | 8 | 208 | 27354 | 75.72 | 1455 | 1452 | 342.1 |
| D | 1 | 52 | 1066285 | 3155.26 | 1468 | 1422 | 337.5 |
| D | 12 | 218 | 737114 | 2179.9 | 1468 | 1422 | 337.5 |
| D | 1 | 20 | 531245 | 1569.9 | 1468 | 1422 | 337.5 |
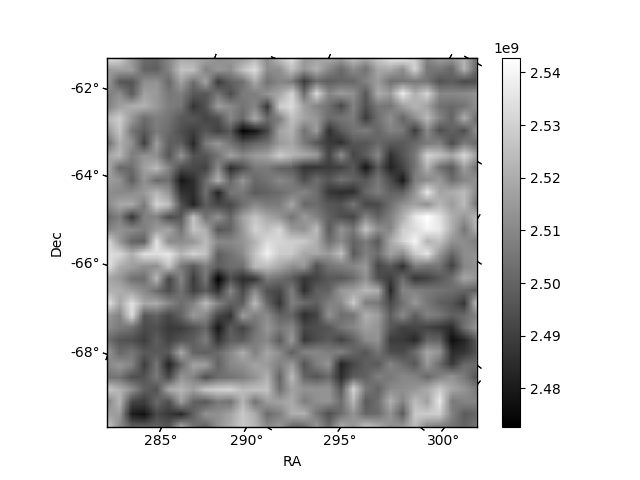
Histogram calculated using DETX and DETY for each event in the final _common_clean file
| Quadrant A |  |
 |
Quadrant B |
|---|---|---|---|
| Quadrant D |  |
 |
Quadrant C |
| Plot type | Count rate plots | Images |
|---|---|---|
| Comparison with Poisson distribution Blue bars denote a histogram of data divided into 1 sec bins. Red curve is a Poisson curve with rate = median count rate of data. |
 |
 |
| Quadrant-wise count rates Data is divided into 100 sec bins |
 |
|
| Module-wise count rates for Quadrant A Data is divided into 100 sec bins |
 |
 |
| Module-wise count rates for Quadrant B Data is divided into 100 sec bins |
 |
 |
| Module-wise count rates for Quadrant C Data is divided into 100 sec bins |
 |
 |
| Module-wise count rates for Quadrant D Data is divided into 100 sec bins |
 |
 |
| Parameter | Plot |
|---|---|
| CZT HV Monitor |  |
| D_VDD |  |
| Temperature 1 |  |
| Veto HV Monitor | 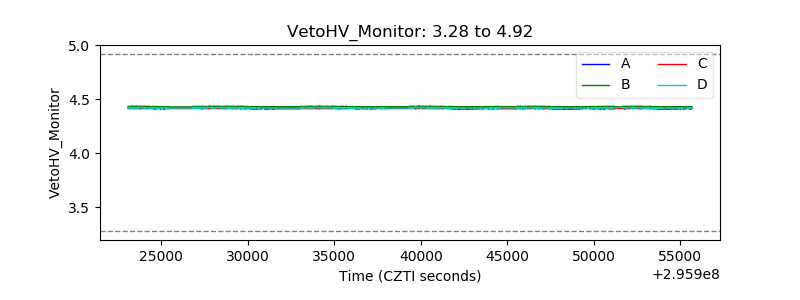 |
| Veto LLD | 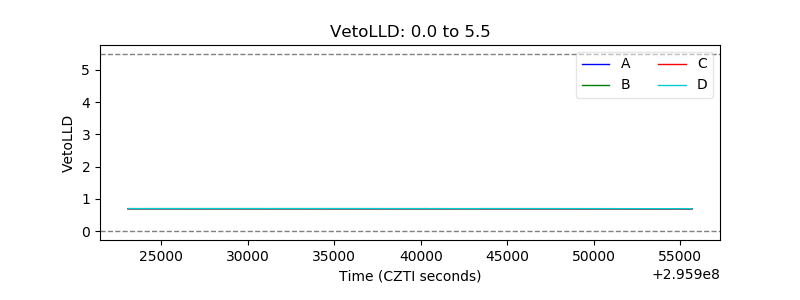 |
| Alpha Counter |  |
| _CPM_Rate |  |
| CZT Counter | 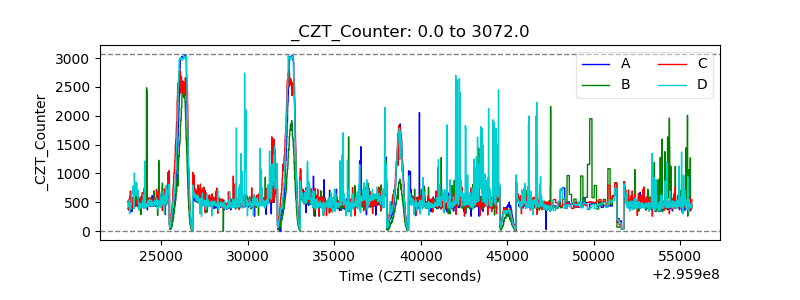 |
| +2.5 Volts monitor |  |
| +5 Volts monitor |  |
| _ROLL_ROT |  |
| _Roll_DEC |  |
| _Roll_RA |  |
| Veto Counter |  |