| Param | Original file | Final file |
|---|---|---|
| Filename | modeM0/AS1A05_212T08_9000002934cztM0_level2_bc.evt | modeM0/AS1A05_212T08_9000002934cztM0_level2_quad_clean.evt |
| Size (bytes) | 329,754,240 | 113,123,520 |
| Size | 314.5 MB | 107.9 MB |
| Events in quadrant A | 1,937,222 | 711,804 |
| Events in quadrant B | 2,876,474 | 713,827 |
| Events in quadrant C | 1,973,797 | 680,851 |
| Events in quadrant D | 2,556,142 | 672,823 |
| Mode M0 | |||
|---|---|---|---|
| Quadrant | BADHDUFLAG | Total packets | Discarded packets |
| A | 0 | 19454 | 0 |
| B | 0 | 23065 | 0 |
| C | 0 | 19427 | 0 |
| D | 0 | 21496 | 0 |
| Mode M9 | |||
|---|---|---|---|
| Quadrant | BADHDUFLAG | Total packets | Discarded packets |
| A | 0 | 14 | 0 |
| B | 0 | 14 | 0 |
| C | 0 | 14 | 0 |
| D | 0 | 14 | 0 |
| Mode SS | |||
|---|---|---|---|
| Quadrant | BADHDUFLAG | Total packets | Discarded packets |
| A | 0 | 192 | 0 |
| B | 0 | 192 | 0 |
| C | 0 | 192 | 0 |
| D | 0 | 192 | 0 |
| Quadrant | Total seconds | Saturated seconds | Saturation percentage |
|---|---|---|---|
| A | 9316 | 124 | 1.331043% |
| B | 9316 | 460 | 4.937742% |
| C | 9316 | 166 | 1.781881% |
| D | 9316 | 196 | 2.103907% |
Noise dominated data is calculated using 1-second bins in cleaned event files. If a bin has >2000 counts, and if more than 50% of those come from <1% of pixels, then it is considered to be noise-dominated and hence unusable.
| Quadrant | # 1 sec bins | Bins with >0 counts | Bins with >2000 counts | High rate bins dominated by noise | Noise dominated (total time) | Noise dominated (detector-on time) | Marked lightcurve |
|---|---|---|---|---|---|---|---|
| A | 10756 | 9315 | 4 | 4 | 0.04% | 0.04% |  |
| B | 10756 | 9313 | 32 | 32 | 0.30% | 0.34% |  |
| C | 10756 | 9314 | 0 | 0 | 0.00% | 0.00% |  |
| D | 10756 | 9314 | 9 | 9 | 0.08% | 0.10% | 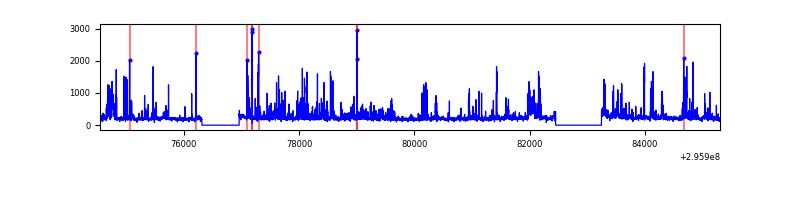 |
Top three noisy pixels from each quadrant. If the there are fewer than three noisy pixels in the level2.evt file, extra rows are filled as -1
| Pixel properties | Quadrant properties | ||||||
|---|---|---|---|---|---|---|---|
| Quadrant | DetID | PixID | Counts | Sigma | Mean | Median | Sigma |
| A | 5 | 16 | 75857 | 712.64 | 474 | 463 | 105.8 |
| A | 11 | 29 | 26384 | 245.01 | 474 | 463 | 105.8 |
| A | 9 | 143 | 8453 | 75.52 | 474 | 463 | 105.8 |
| B | 3 | 112 | 890744 | 9620.35 | 469 | 455 | 92.5 |
| B | 0 | 230 | 89707 | 964.45 | 469 | 455 | 92.5 |
| B | 4 | 216 | 28252 | 300.37 | 469 | 455 | 92.5 |
| C | 8 | 208 | 99510 | 911.38 | 454 | 449 | 108.7 |
| C | 3 | 233 | 80364 | 735.23 | 454 | 449 | 108.7 |
| C | 7 | 247 | 18289 | 164.13 | 454 | 449 | 108.7 |
| D | 1 | 52 | 445853 | 4066.7 | 463 | 443 | 109.5 |
| D | 12 | 218 | 280327 | 2555.41 | 463 | 443 | 109.5 |
| D | 2 | 234 | 37192 | 335.53 | 463 | 443 | 109.5 |
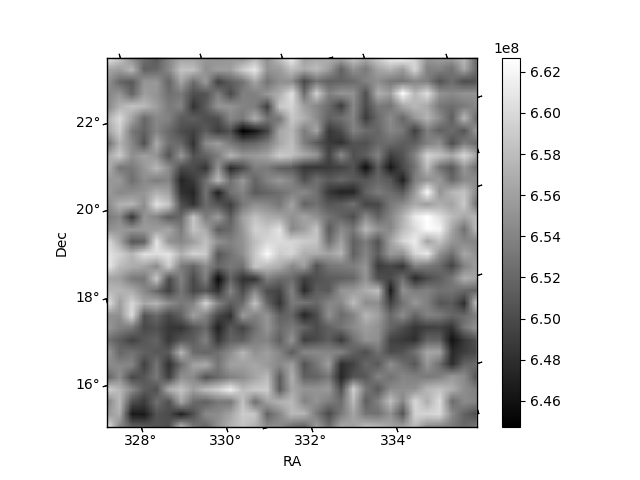
Histogram calculated using DETX and DETY for each event in the final _common_clean file
| Quadrant A |  |
 |
Quadrant B |
|---|---|---|---|
| Quadrant D |  |
 |
Quadrant C |
| Plot type | Count rate plots | Images |
|---|---|---|
| Comparison with Poisson distribution Blue bars denote a histogram of data divided into 1 sec bins. Red curve is a Poisson curve with rate = median count rate of data. |
 |
 |
| Quadrant-wise count rates Data is divided into 100 sec bins |
 |
|
| Module-wise count rates for Quadrant A Data is divided into 100 sec bins |
 |
 |
| Module-wise count rates for Quadrant B Data is divided into 100 sec bins |
 |
 |
| Module-wise count rates for Quadrant C Data is divided into 100 sec bins |
 |
 |
| Module-wise count rates for Quadrant D Data is divided into 100 sec bins |
 |
 |
| Parameter | Plot |
|---|---|
| CZT HV Monitor | 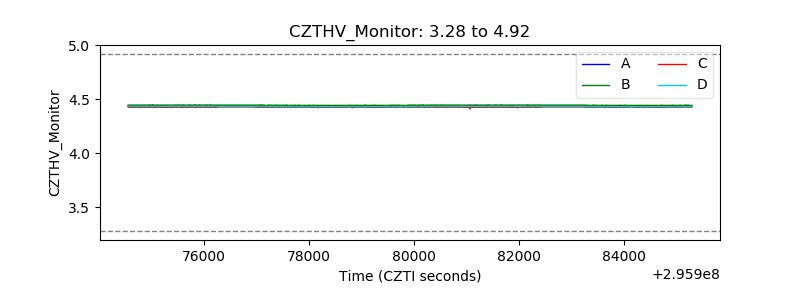 |
| D_VDD | 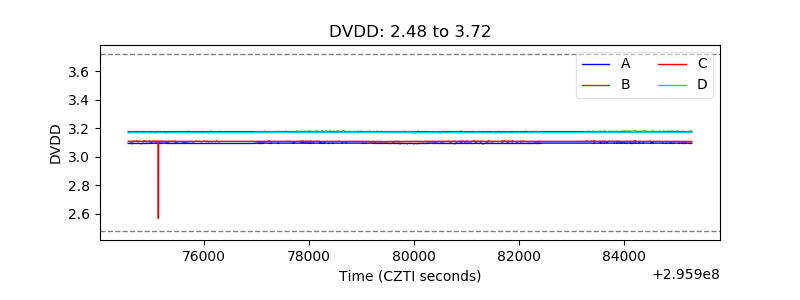 |
| Temperature 1 |  |
| Veto HV Monitor |  |
| Veto LLD |  |
| Alpha Counter | 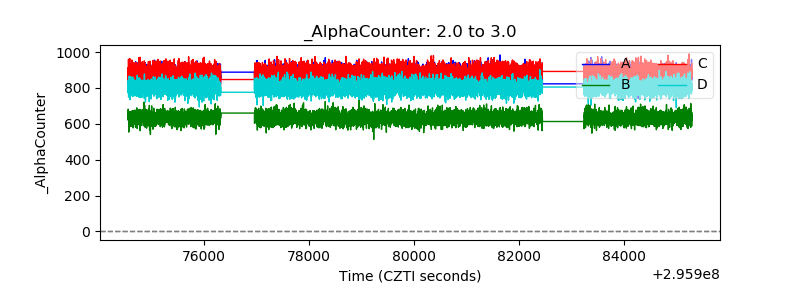 |
| _CPM_Rate | 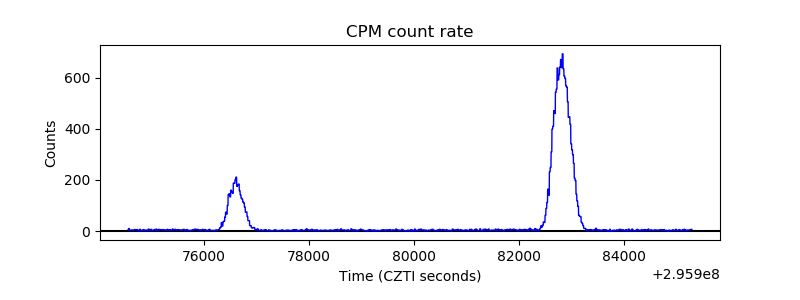 |
| CZT Counter |  |
| +2.5 Volts monitor |  |
| +5 Volts monitor |  |
| _ROLL_ROT | 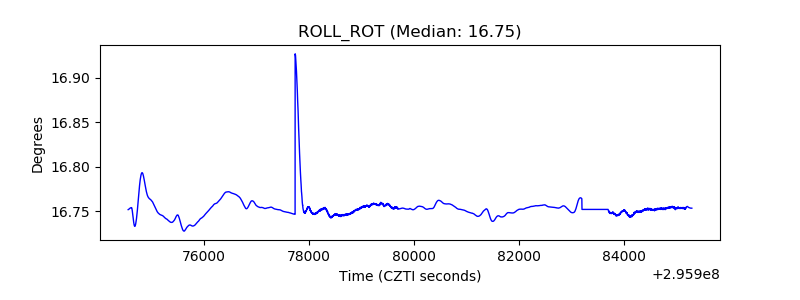 |
| _Roll_DEC | 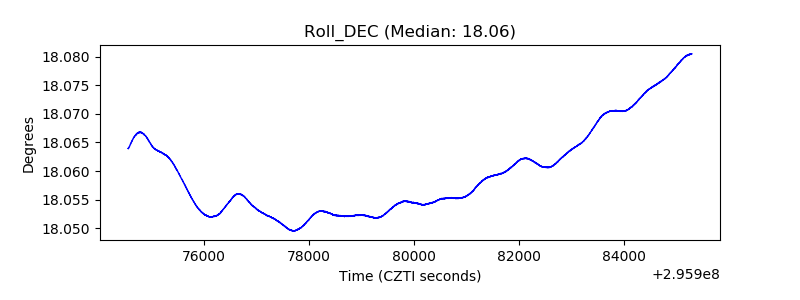 |
| _Roll_RA |  |
| Veto Counter |  |