| Param | Original file | Final file |
|---|---|---|
| Filename | modeM0/AS1A05_025T18_9000002932cztM0_level2_bc.evt | modeM0/AS1A05_025T18_9000002932cztM0_level2_quad_clean.evt |
| Size (bytes) | 590,310,720 | 226,592,640 |
| Size | 563.0 MB | 216.1 MB |
| Events in quadrant A | 3,346,354 | 1,453,093 |
| Events in quadrant B | 4,065,540 | 1,465,573 |
| Events in quadrant C | 4,317,344 | 1,403,279 |
| Events in quadrant D | 4,998,737 | 1,384,831 |
| Mode M9 | |||
|---|---|---|---|
| Quadrant | BADHDUFLAG | Total packets | Discarded packets |
| A | 0 | 7 | 0 |
| B | 0 | 7 | 0 |
| C | 0 | 7 | 0 |
| D | 0 | 7 | 0 |
| Mode SS | |||
|---|---|---|---|
| Quadrant | BADHDUFLAG | Total packets | Discarded packets |
| A | 0 | 338 | 0 |
| B | 0 | 338 | 0 |
| C | 0 | 338 | 0 |
| D | 0 | 338 | 0 |
| Mode M0 | |||
|---|---|---|---|
| Quadrant | BADHDUFLAG | Total packets | Discarded packets |
| A | 0 | 34929 | 0 |
| B | 0 | 37185 | 0 |
| C | 0 | 37761 | 0 |
| D | 0 | 39873 | 0 |
| Quadrant | Total seconds | Saturated seconds | Saturation percentage |
|---|---|---|---|
| A | 16768 | 431 | 2.570372% |
| B | 16768 | 565 | 3.369513% |
| C | 16768 | 559 | 3.333731% |
| D | 16768 | 585 | 3.488788% |
Noise dominated data is calculated using 1-second bins in cleaned event files. If a bin has >2000 counts, and if more than 50% of those come from <1% of pixels, then it is considered to be noise-dominated and hence unusable.
| Quadrant | # 1 sec bins | Bins with >0 counts | Bins with >2000 counts | High rate bins dominated by noise | Noise dominated (total time) | Noise dominated (detector-on time) | Marked lightcurve |
|---|---|---|---|---|---|---|---|
| A | 17483 | 16767 | 3 | 3 | 0.02% | 0.02% |  |
| B | 17483 | 16767 | 14 | 14 | 0.08% | 0.08% |  |
| C | 17483 | 16767 | 0 | 0 | 0.00% | 0.00% |  |
| D | 17483 | 16768 | 54 | 54 | 0.31% | 0.32% |  |
Top three noisy pixels from each quadrant. If the there are fewer than three noisy pixels in the level2.evt file, extra rows are filled as -1
| Pixel properties | Quadrant properties | ||||||
|---|---|---|---|---|---|---|---|
| Quadrant | DetID | PixID | Counts | Sigma | Mean | Median | Sigma |
| A | 11 | 29 | 67794 | 364.72 | 833 | 814 | 183.6 |
| A | 5 | 16 | 58373 | 313.42 | 833 | 814 | 183.6 |
| A | 13 | 254 | 14078 | 72.23 | 833 | 814 | 183.6 |
| B | 3 | 112 | 537947 | 3268.45 | 836 | 812 | 164.3 |
| B | 7 | 220 | 69349 | 417.05 | 836 | 812 | 164.3 |
| B | 0 | 197 | 65776 | 395.3 | 836 | 812 | 164.3 |
| C | 8 | 208 | 864798 | 4490.81 | 809 | 801 | 192.4 |
| C | 3 | 233 | 219598 | 1137.24 | 809 | 801 | 192.4 |
| C | 9 | 221 | 82293 | 423.57 | 809 | 801 | 192.4 |
| D | 1 | 52 | 1054726 | 5464.12 | 824 | 794 | 192.9 |
| D | 12 | 218 | 416123 | 2153.28 | 824 | 794 | 192.9 |
| D | 1 | 20 | 172959 | 892.59 | 824 | 794 | 192.9 |
Histogram calculated using DETX and DETY for each event in the final _common_clean file
| Quadrant A | 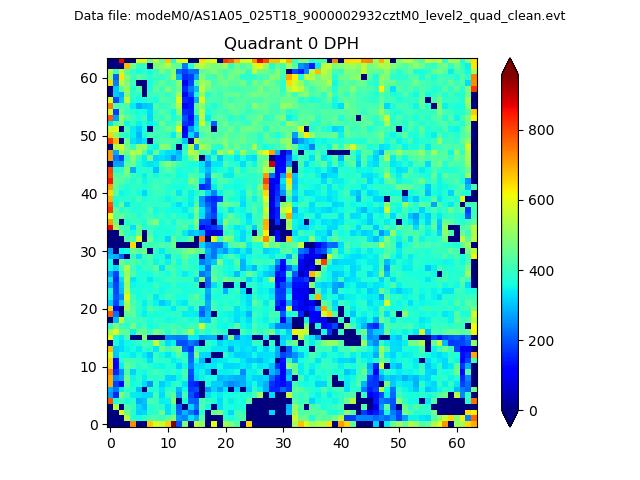 |
 |
Quadrant B |
|---|---|---|---|
| Quadrant D |  |
 |
Quadrant C |
| Plot type | Count rate plots | Images |
|---|---|---|
| Comparison with Poisson distribution Blue bars denote a histogram of data divided into 1 sec bins. Red curve is a Poisson curve with rate = median count rate of data. |
 |
 |
| Quadrant-wise count rates Data is divided into 100 sec bins |
 |
|
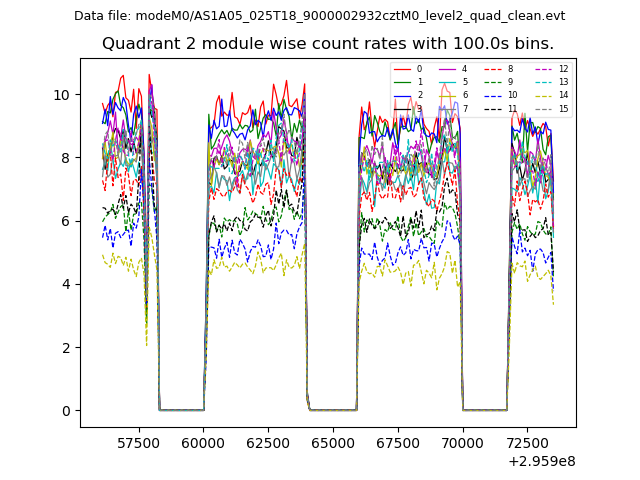
| Module-wise count rates for Quadrant A Data is divided into 100 sec bins |
 |
 |
| Module-wise count rates for Quadrant B Data is divided into 100 sec bins |
 |
 |
| Module-wise count rates for Quadrant C Data is divided into 100 sec bins |
 |
 |
| Module-wise count rates for Quadrant D Data is divided into 100 sec bins |
 |
 |
| Parameter | Plot |
|---|---|
| CZT HV Monitor |  |
| D_VDD |  |
| Temperature 1 |  |
| Veto HV Monitor |  |
| Veto LLD |  |
| Alpha Counter | 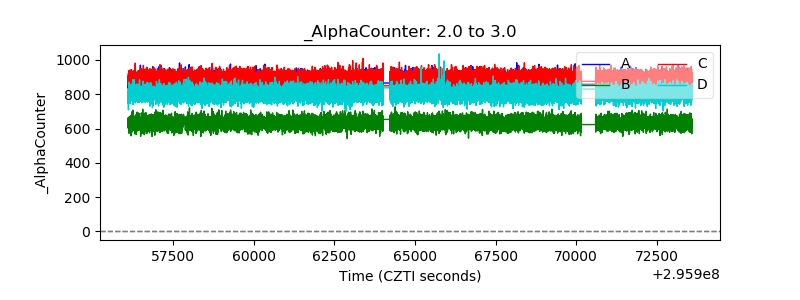 |
| _CPM_Rate |  |
| CZT Counter |  |
| +2.5 Volts monitor |  |
| +5 Volts monitor |  |
| _ROLL_ROT |  |
| _Roll_DEC |  |
| _Roll_RA |  |
| Veto Counter |  |