| Param | Original file | Final file |
|---|---|---|
| Filename | modeM0/AS1T03_005T01_9000002928cztM0_level2_bc.evt | modeM0/AS1T03_005T01_9000002928cztM0_level2_quad_clean.evt |
| Size (bytes) | 2,434,003,200 | 933,396,480 |
| Size | 2.3 GB | 890.2 MB |
| Events in quadrant A | 15,536,721 | 5,925,893 |
| Events in quadrant B | 16,415,794 | 6,011,817 |
| Events in quadrant C | 15,166,408 | 5,691,090 |
| Events in quadrant D | 21,542,738 | 5,562,972 |
| Mode SS | |||
|---|---|---|---|
| Quadrant | BADHDUFLAG | Total packets | Discarded packets |
| A | 0 | 1510 | 0 |
| B | 0 | 1510 | 0 |
| C | 0 | 1510 | 0 |
| D | 0 | 1510 | 0 |
| Mode M9 | |||
|---|---|---|---|
| Quadrant | BADHDUFLAG | Total packets | Discarded packets |
| A | 0 | 120 | 0 |
| B | 0 | 120 | 0 |
| C | 0 | 120 | 0 |
| D | 0 | 120 | 0 |
| Mode M0 | |||
|---|---|---|---|
| Quadrant | BADHDUFLAG | Total packets | Discarded packets |
| A | 0 | 153758 | 0 |
| B | 0 | 157059 | 0 |
| C | 0 | 154381 | 0 |
| D | 0 | 173071 | 0 |
| Quadrant | Total seconds | Saturated seconds | Saturation percentage |
|---|---|---|---|
| A | 74097 | 1081 | 1.458898% |
| B | 74097 | 1385 | 1.869171% |
| C | 74097 | 1334 | 1.800343% |
| D | 74097 | 1444 | 1.948797% |
Noise dominated data is calculated using 1-second bins in cleaned event files. If a bin has >2000 counts, and if more than 50% of those come from <1% of pixels, then it is considered to be noise-dominated and hence unusable.
| Quadrant | # 1 sec bins | Bins with >0 counts | Bins with >2000 counts | High rate bins dominated by noise | Noise dominated (total time) | Noise dominated (detector-on time) | Marked lightcurve |
|---|---|---|---|---|---|---|---|
| A | 86122 | 74091 | 9 | 9 | 0.01% | 0.01% |  |
| B | 86122 | 74088 | 19 | 19 | 0.02% | 0.03% |  |
| C | 86122 | 74088 | 0 | 0 | 0.00% | 0.00% |  |
| D | 86122 | 74088 | 173 | 173 | 0.20% | 0.23% |  |
Top three noisy pixels from each quadrant. If the there are fewer than three noisy pixels in the level2.evt file, extra rows are filled as -1
| Pixel properties | Quadrant properties | ||||||
|---|---|---|---|---|---|---|---|
| Quadrant | DetID | PixID | Counts | Sigma | Mean | Median | Sigma |
| A | 13 | 252 | 233030 | 271.74 | 3917 | 3849 | 843.4 |
| A | 11 | 29 | 145595 | 168.07 | 3917 | 3849 | 843.4 |
| A | 13 | 254 | 62889 | 70.0 | 3917 | 3849 | 843.4 |
| B | 7 | 220 | 333313 | 441.81 | 3967 | 3869 | 745.7 |
| B | 0 | 198 | 223770 | 294.9 | 3967 | 3869 | 745.7 |
| B | 3 | 112 | 166121 | 217.59 | 3967 | 3869 | 745.7 |
| C | 3 | 233 | 508957 | 572.44 | 3761 | 3733 | 882.6 |
| C | 9 | 221 | 116819 | 128.13 | 3761 | 3733 | 882.6 |
| C | 4 | 175 | 31998 | 32.03 | 3761 | 3733 | 882.6 |
| D | 1 | 20 | 4016159 | 4521.25 | 3820 | 3680 | 887.5 |
| D | 1 | 52 | 1364158 | 1532.98 | 3820 | 3680 | 887.5 |
| D | 12 | 218 | 533757 | 597.29 | 3820 | 3680 | 887.5 |
Histogram calculated using DETX and DETY for each event in the final _common_clean file
| Quadrant A |  |
 |
Quadrant B |
|---|---|---|---|
| Quadrant D |  |
 |
Quadrant C |
| Plot type | Count rate plots | Images |
|---|---|---|
| Comparison with Poisson distribution Blue bars denote a histogram of data divided into 1 sec bins. Red curve is a Poisson curve with rate = median count rate of data. |
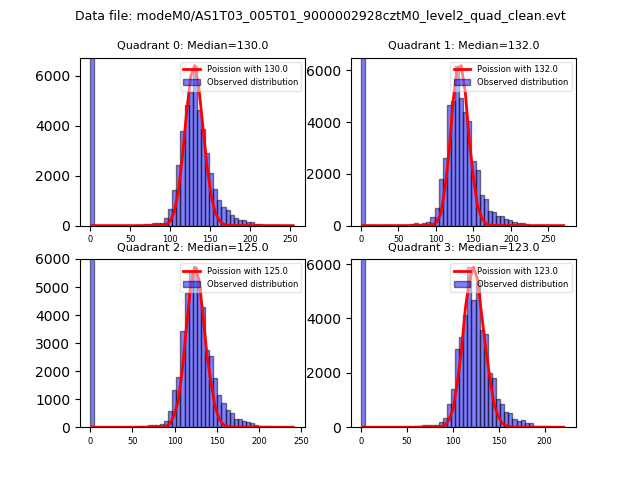 |
 |
| Quadrant-wise count rates Data is divided into 100 sec bins |
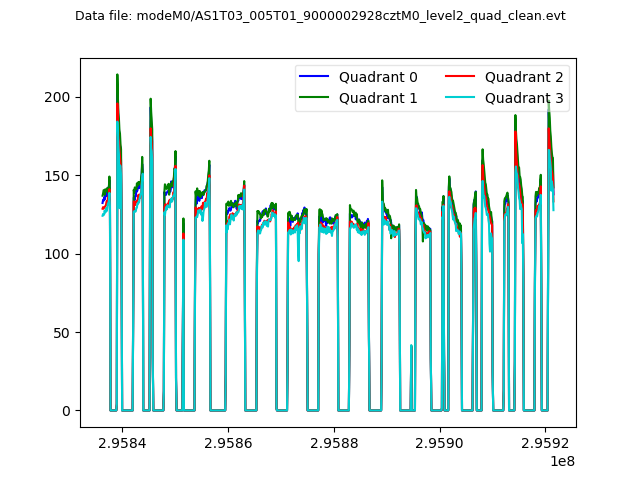 |
|
| Module-wise count rates for Quadrant A Data is divided into 100 sec bins |
 |
 |
| Module-wise count rates for Quadrant B Data is divided into 100 sec bins |
 |
 |
| Module-wise count rates for Quadrant C Data is divided into 100 sec bins |
 |
 |
| Module-wise count rates for Quadrant D Data is divided into 100 sec bins |
 |
 |
| Parameter | Plot |
|---|---|
| CZT HV Monitor |  |
| D_VDD |  |
| Temperature 1 |  |
| Veto HV Monitor |  |
| Veto LLD |  |
| Alpha Counter |  |
| _CPM_Rate |  |
| CZT Counter |  |
| +2.5 Volts monitor | 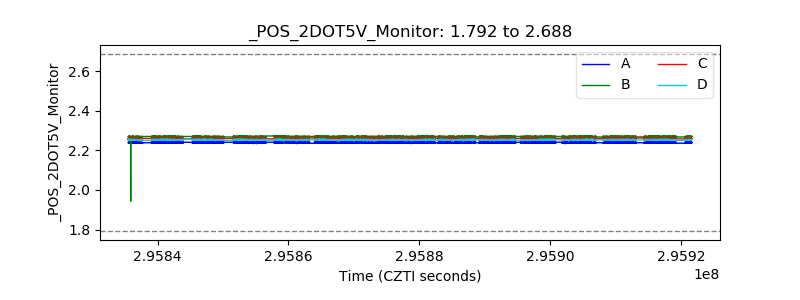 |
| +5 Volts monitor |  |
| _ROLL_ROT |  |
| _Roll_DEC |  |
| _Roll_RA |  |
| Veto Counter |  |