| Param | Original file | Final file |
|---|---|---|
| Filename | modeM0/AS1A06_003T02_9000002926cztM0_level2_bc.evt | modeM0/AS1A06_003T02_9000002926cztM0_level2_quad_clean.evt |
| Size (bytes) | 1,225,074,240 | 402,773,760 |
| Size | 1.1 GB | 384.1 MB |
| Events in quadrant A | 6,553,457 | 2,631,932 |
| Events in quadrant B | 7,257,405 | 2,663,676 |
| Events in quadrant C | 6,279,871 | 2,540,987 |
| Events in quadrant D | 14,775,211 | 2,114,714 |
| Mode SS | |||
|---|---|---|---|
| Quadrant | BADHDUFLAG | Total packets | Discarded packets |
| A | 0 | 666 | 0 |
| B | 0 | 666 | 0 |
| C | 0 | 666 | 0 |
| D | 0 | 666 | 0 |
| Mode M9 | |||
|---|---|---|---|
| Quadrant | BADHDUFLAG | Total packets | Discarded packets |
| A | 0 | 43 | 0 |
| B | 0 | 43 | 0 |
| C | 0 | 44 | 0 |
| D | 0 | 44 | 0 |
| Mode M0 | |||
|---|---|---|---|
| Quadrant | BADHDUFLAG | Total packets | Discarded packets |
| A | 0 | 67594 | 0 |
| B | 0 | 69843 | 0 |
| C | 0 | 67434 | 0 |
| D | 0 | 110203 | 0 |
| Quadrant | Total seconds | Saturated seconds | Saturation percentage |
|---|---|---|---|
| A | 32685 | 541 | 1.655194% |
| B | 32685 | 674 | 2.062108% |
| C | 32685 | 643 | 1.967263% |
| D | 32685 | 5202 | 15.915558% |
Noise dominated data is calculated using 1-second bins in cleaned event files. If a bin has >2000 counts, and if more than 50% of those come from <1% of pixels, then it is considered to be noise-dominated and hence unusable.
| Quadrant | # 1 sec bins | Bins with >0 counts | Bins with >2000 counts | High rate bins dominated by noise | Noise dominated (total time) | Noise dominated (detector-on time) | Marked lightcurve |
|---|---|---|---|---|---|---|---|
| A | 46856 | 32686 | 11 | 11 | 0.02% | 0.03% |  |
| B | 46856 | 32683 | 5 | 5 | 0.01% | 0.02% |  |
| C | 46856 | 32686 | 0 | 0 | 0.00% | 0.00% |  |
| D | 46856 | 32685 | 414 | 414 | 0.88% | 1.27% |  |
Top three noisy pixels from each quadrant. If the there are fewer than three noisy pixels in the level2.evt file, extra rows are filled as -1
| Pixel properties | Quadrant properties | ||||||
|---|---|---|---|---|---|---|---|
| Quadrant | DetID | PixID | Counts | Sigma | Mean | Median | Sigma |
| A | 5 | 16 | 115785 | 312.4 | 1663 | 1629 | 365.4 |
| A | 13 | 254 | 25787 | 66.11 | 1663 | 1629 | 365.4 |
| A | 11 | 29 | 13314 | 31.98 | 1663 | 1629 | 365.4 |
| B | 3 | 112 | 270056 | 837.85 | 1680 | 1637 | 320.4 |
| B | 7 | 220 | 189242 | 585.6 | 1680 | 1637 | 320.4 |
| B | 4 | 216 | 72798 | 222.12 | 1680 | 1637 | 320.4 |
| C | 3 | 233 | 56402 | 143.82 | 1610 | 1596 | 381.1 |
| C | 9 | 221 | 12048 | 27.43 | 1610 | 1596 | 381.1 |
| C | 7 | 247 | 12045 | 27.42 | 1610 | 1596 | 381.1 |
| D | 1 | 20 | 3997144 | 11408.37 | 1482 | 1423 | 350.2 |
| D | 1 | 52 | 2733206 | 7799.64 | 1482 | 1423 | 350.2 |
| D | 12 | 218 | 1563497 | 4459.95 | 1482 | 1423 | 350.2 |
Histogram calculated using DETX and DETY for each event in the final _common_clean file
| Quadrant A | 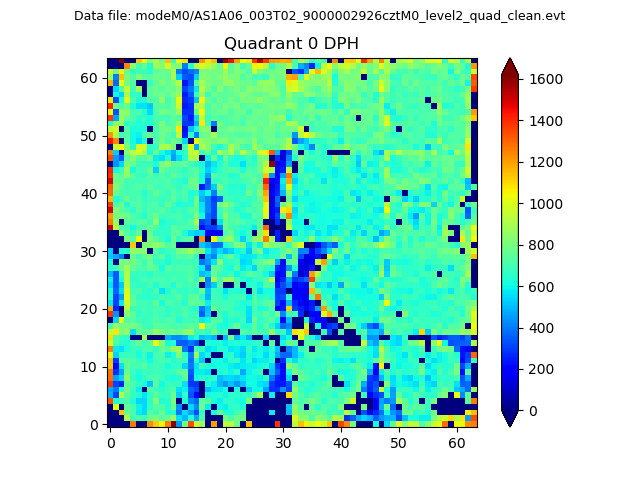 |
 |
Quadrant B |
|---|---|---|---|
| Quadrant D |  |
 |
Quadrant C |
| Plot type | Count rate plots | Images |
|---|---|---|
| Comparison with Poisson distribution Blue bars denote a histogram of data divided into 1 sec bins. Red curve is a Poisson curve with rate = median count rate of data. |
 |
 |
| Quadrant-wise count rates Data is divided into 100 sec bins |
 |
|
| Module-wise count rates for Quadrant A Data is divided into 100 sec bins |
 |
 |
| Module-wise count rates for Quadrant B Data is divided into 100 sec bins |
 |
 |
| Module-wise count rates for Quadrant C Data is divided into 100 sec bins |
 |
 |
| Module-wise count rates for Quadrant D Data is divided into 100 sec bins |
 |
 |
| Parameter | Plot |
|---|---|
| CZT HV Monitor |  |
| D_VDD |  |
| Temperature 1 |  |
| Veto HV Monitor |  |
| Veto LLD |  |
| Alpha Counter |  |
| _CPM_Rate |  |
| CZT Counter |  |
| +2.5 Volts monitor |  |
| +5 Volts monitor |  |
| _ROLL_ROT |  |
| _Roll_DEC |  |
| _Roll_RA |  |
| Veto Counter |  |