| Param | Original file | Final file |
|---|---|---|
| Filename | modeM0/AS1A05_101T10_9000002924cztM0_level2_bc.evt | modeM0/AS1A05_101T10_9000002924cztM0_level2_quad_clean.evt |
| Size (bytes) | 428,650,560 | 194,616,000 |
| Size | 408.8 MB | 185.6 MB |
| Events in quadrant A | 2,379,690 | 1,322,308 |
| Events in quadrant B | 2,406,583 | 1,336,349 |
| Events in quadrant C | 2,010,098 | 1,307,792 |
| Events in quadrant D | 5,459,221 | 1,197,549 |
| Mode M9 | |||
|---|---|---|---|
| Quadrant | BADHDUFLAG | Total packets | Discarded packets |
| A | 0 | 16 | 0 |
| B | 0 | 16 | 0 |
| C | 0 | 16 | 0 |
| D | 0 | 16 | 0 |
| Mode M0 | |||
|---|---|---|---|
| Quadrant | BADHDUFLAG | Total packets | Discarded packets |
| A | 0 | 22529 | 0 |
| B | 0 | 22512 | 0 |
| C | 0 | 21585 | 0 |
| D | 0 | 34437 | 0 |
| Mode SS | |||
|---|---|---|---|
| Quadrant | BADHDUFLAG | Total packets | Discarded packets |
| A | 0 | 214 | 0 |
| B | 0 | 214 | 0 |
| C | 0 | 214 | 0 |
| D | 0 | 214 | 0 |
| Quadrant | Total seconds | Saturated seconds | Saturation percentage |
|---|---|---|---|
| A | 10555 | 235 | 2.226433% |
| B | 10555 | 214 | 2.027475% |
| C | 10555 | 252 | 2.387494% |
| D | 10555 | 1636 | 15.499763% |
Noise dominated data is calculated using 1-second bins in cleaned event files. If a bin has >2000 counts, and if more than 50% of those come from <1% of pixels, then it is considered to be noise-dominated and hence unusable.
| Quadrant | # 1 sec bins | Bins with >0 counts | Bins with >2000 counts | High rate bins dominated by noise | Noise dominated (total time) | Noise dominated (detector-on time) | Marked lightcurve |
|---|---|---|---|---|---|---|---|
| A | 12000 | 10554 | 14 | 14 | 0.12% | 0.13% |  |
| B | 12000 | 10554 | 2 | 2 | 0.02% | 0.02% | 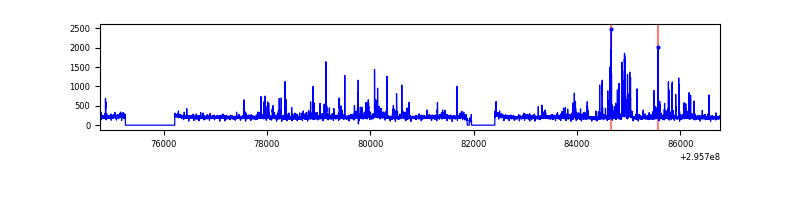 |
| C | 12000 | 10553 | 0 | 0 | 0.00% | 0.00% |  |
| D | 12000 | 10552 | 227 | 227 | 1.89% | 2.15% | 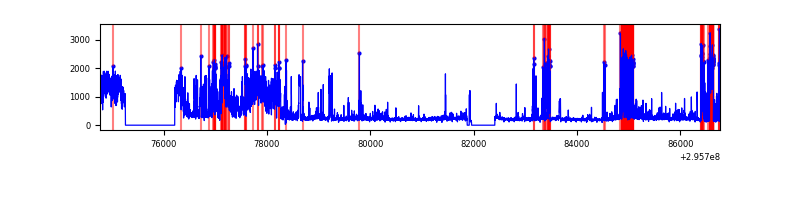 |
Top three noisy pixels from each quadrant. If the there are fewer than three noisy pixels in the level2.evt file, extra rows are filled as -1
| Pixel properties | Quadrant properties | ||||||
|---|---|---|---|---|---|---|---|
| Quadrant | DetID | PixID | Counts | Sigma | Mean | Median | Sigma |
| A | 9 | 143 | 192478 | 1633.44 | 529 | 518 | 117.5 |
| A | 5 | 16 | 134647 | 1141.34 | 529 | 518 | 117.5 |
| A | 13 | 254 | 7397 | 58.54 | 529 | 518 | 117.5 |
| B | 3 | 112 | 207424 | 2014.65 | 531 | 519 | 102.7 |
| B | 4 | 216 | 30490 | 291.83 | 531 | 519 | 102.7 |
| B | 7 | 220 | 27213 | 259.92 | 531 | 519 | 102.7 |
| C | 3 | 233 | 14534 | 111.81 | 517 | 512 | 125.4 |
| C | 9 | 221 | 7421 | 55.09 | 517 | 512 | 125.4 |
| C | 13 | 61 | 3136 | 20.92 | 517 | 512 | 125.4 |
| D | 7 | 238 | 1817517 | 15156.3 | 499 | 480 | 119.9 |
| D | 1 | 52 | 917145 | 7646.1 | 499 | 480 | 119.9 |
| D | 1 | 20 | 632334 | 5270.43 | 499 | 480 | 119.9 |
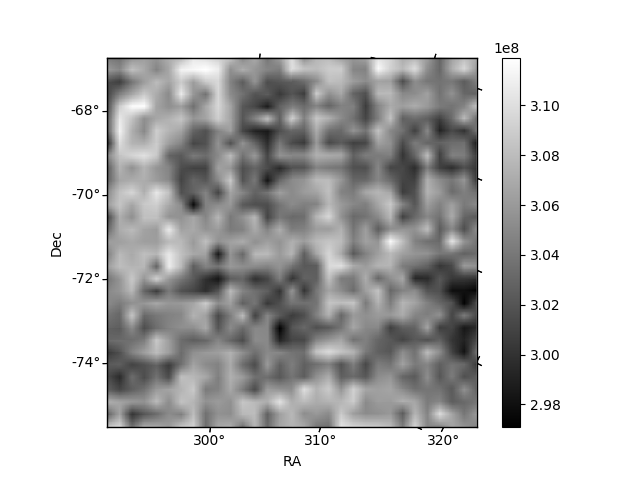
Histogram calculated using DETX and DETY for each event in the final _common_clean file
| Quadrant A |  |
 |
Quadrant B |
|---|---|---|---|
| Quadrant D |  |
 |
Quadrant C |
| Plot type | Count rate plots | Images |
|---|---|---|
| Comparison with Poisson distribution Blue bars denote a histogram of data divided into 1 sec bins. Red curve is a Poisson curve with rate = median count rate of data. |
 |
 |
| Quadrant-wise count rates Data is divided into 100 sec bins |
 |
|
| Module-wise count rates for Quadrant A Data is divided into 100 sec bins |
 |
 |
| Module-wise count rates for Quadrant B Data is divided into 100 sec bins |
 |
 |
| Module-wise count rates for Quadrant C Data is divided into 100 sec bins |
 |
 |
| Module-wise count rates for Quadrant D Data is divided into 100 sec bins |
 |
 |
| Parameter | Plot |
|---|---|
| CZT HV Monitor |  |
| D_VDD |  |
| Temperature 1 | 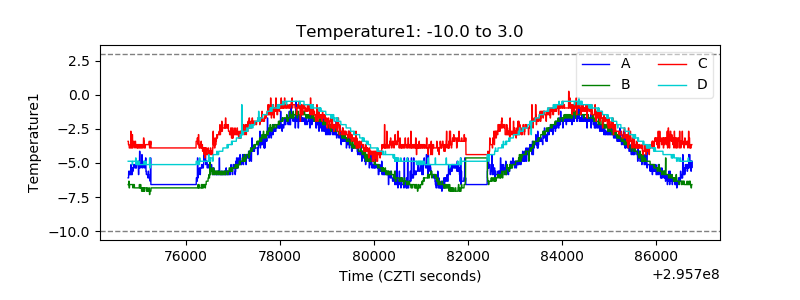 |
| Veto HV Monitor | 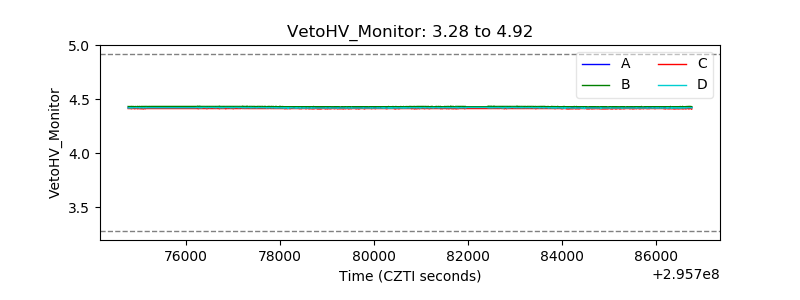 |
| Veto LLD |  |
| Alpha Counter |  |
| _CPM_Rate |  |
| CZT Counter |  |
| +2.5 Volts monitor | 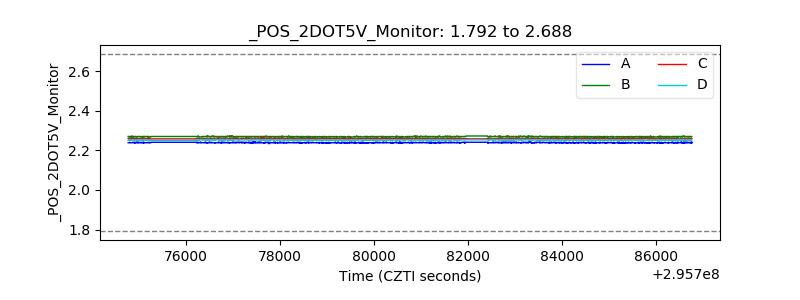 |
| +5 Volts monitor |  |
| _ROLL_ROT | 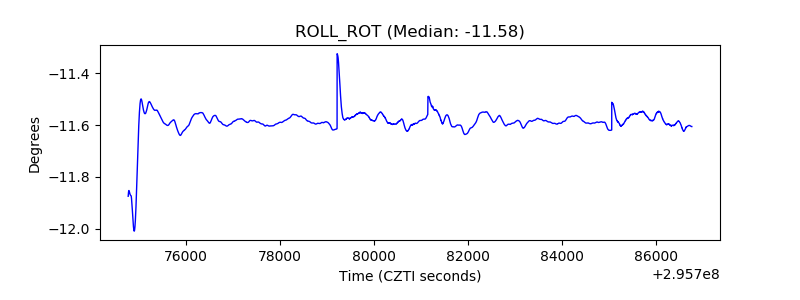 |
| _Roll_DEC |  |
| _Roll_RA |  |
| Veto Counter |  |