| Param | Original file | Final file |
|---|---|---|
| Filename | modeM0/AS1A05_101T08_9000002922cztM0_level2_bc.evt | modeM0/AS1A05_101T08_9000002922cztM0_level2_quad_clean.evt |
| Size (bytes) | 1,411,171,200 | 457,073,280 |
| Size | 1.3 GB | 435.9 MB |
| Events in quadrant A | 7,146,573 | 2,956,149 |
| Events in quadrant B | 8,734,168 | 2,998,865 |
| Events in quadrant C | 7,062,973 | 2,909,625 |
| Events in quadrant D | 17,552,734 | 2,722,030 |
| Mode M9 | |||
|---|---|---|---|
| Quadrant | BADHDUFLAG | Total packets | Discarded packets |
| A | 0 | 74 | 0 |
| B | 0 | 74 | 0 |
| C | 0 | 74 | 0 |
| D | 0 | 74 | 0 |
| Mode M0 | |||
|---|---|---|---|
| Quadrant | BADHDUFLAG | Total packets | Discarded packets |
| A | 0 | 68066 | 0 |
| B | 0 | 73909 | 0 |
| C | 0 | 68688 | 0 |
| D | 0 | 108948 | 0 |
| Mode SS | |||
|---|---|---|---|
| Quadrant | BADHDUFLAG | Total packets | Discarded packets |
| A | 0 | 670 | 0 |
| B | 0 | 670 | 0 |
| C | 0 | 670 | 0 |
| D | 0 | 670 | 0 |
| Quadrant | Total seconds | Saturated seconds | Saturation percentage |
|---|---|---|---|
| A | 32853 | 209 | 0.636167% |
| B | 32853 | 540 | 1.643686% |
| C | 32853 | 344 | 1.047089% |
| D | 32853 | 3011 | 9.165069% |
Noise dominated data is calculated using 1-second bins in cleaned event files. If a bin has >2000 counts, and if more than 50% of those come from <1% of pixels, then it is considered to be noise-dominated and hence unusable.
| Quadrant | # 1 sec bins | Bins with >0 counts | Bins with >2000 counts | High rate bins dominated by noise | Noise dominated (total time) | Noise dominated (detector-on time) | Marked lightcurve |
|---|---|---|---|---|---|---|---|
| A | 40269 | 32852 | 2 | 2 | 0.00% | 0.01% | 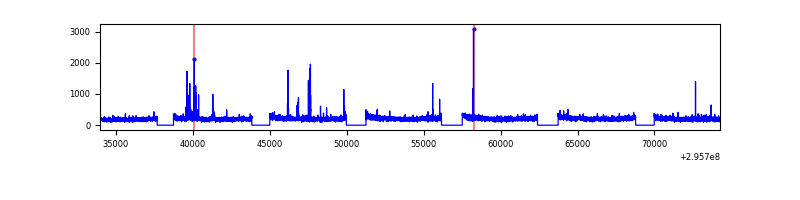 |
| B | 40269 | 32853 | 51 | 51 | 0.13% | 0.16% |  |
| C | 40269 | 32855 | 0 | 0 | 0.00% | 0.00% |  |
| D | 40269 | 32855 | 313 | 313 | 0.78% | 0.95% |  |
Top three noisy pixels from each quadrant. If the there are fewer than three noisy pixels in the level2.evt file, extra rows are filled as -1
| Pixel properties | Quadrant properties | ||||||
|---|---|---|---|---|---|---|---|
| Quadrant | DetID | PixID | Counts | Sigma | Mean | Median | Sigma |
| A | 5 | 16 | 104111 | 265.06 | 1824 | 1796 | 386.0 |
| A | 13 | 254 | 30458 | 74.25 | 1824 | 1796 | 386.0 |
| A | 0 | 226 | 11959 | 26.33 | 1824 | 1796 | 386.0 |
| B | 3 | 112 | 1266874 | 3726.5 | 1837 | 1798 | 339.5 |
| B | 7 | 220 | 169110 | 492.85 | 1837 | 1798 | 339.5 |
| B | 4 | 216 | 67451 | 193.39 | 1837 | 1798 | 339.5 |
| C | 3 | 233 | 112908 | 264.55 | 1796 | 1790 | 420.0 |
| C | 8 | 208 | 15206 | 31.94 | 1796 | 1790 | 420.0 |
| C | 9 | 221 | 14695 | 30.72 | 1796 | 1790 | 420.0 |
| D | 7 | 238 | 5363595 | 13263.6 | 1764 | 1710 | 404.3 |
| D | 1 | 52 | 2796445 | 6913.28 | 1764 | 1710 | 404.3 |
| D | 12 | 218 | 2176653 | 5380.12 | 1764 | 1710 | 404.3 |
Histogram calculated using DETX and DETY for each event in the final _common_clean file
| Quadrant A | 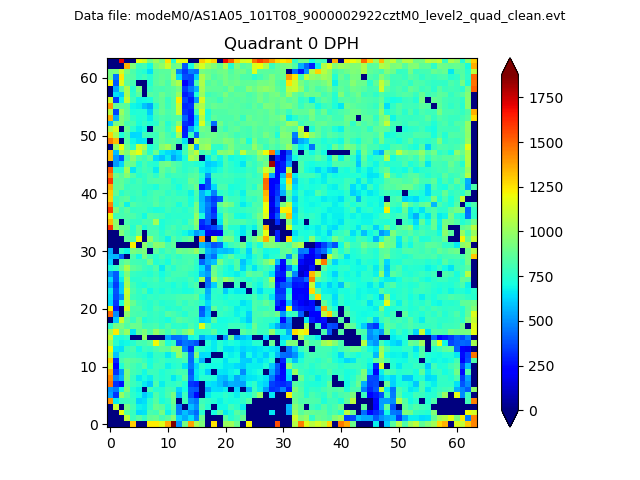 |
 |
Quadrant B |
|---|---|---|---|
| Quadrant D |  |
 |
Quadrant C |
| Plot type | Count rate plots | Images |
|---|---|---|
| Comparison with Poisson distribution Blue bars denote a histogram of data divided into 1 sec bins. Red curve is a Poisson curve with rate = median count rate of data. |
 |
 |
| Quadrant-wise count rates Data is divided into 100 sec bins |
 |
|
| Module-wise count rates for Quadrant A Data is divided into 100 sec bins |
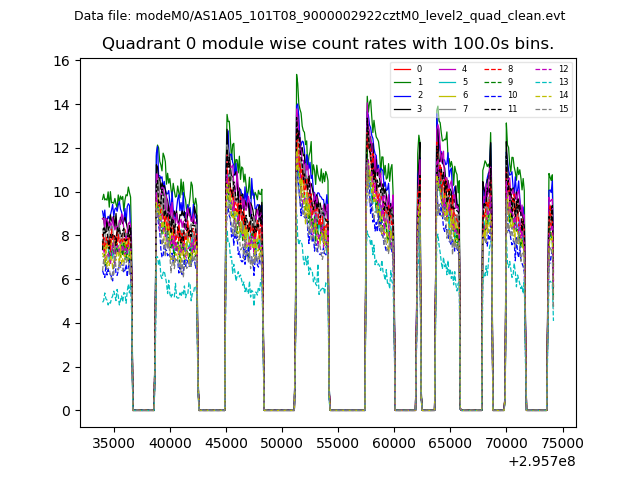 |
 |
| Module-wise count rates for Quadrant B Data is divided into 100 sec bins |
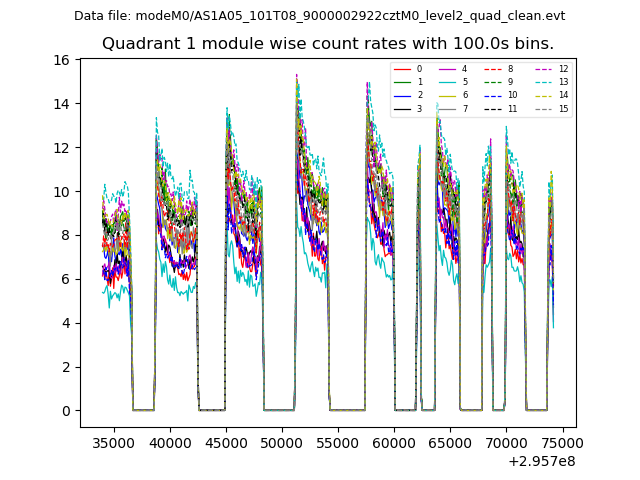 |
 |
| Module-wise count rates for Quadrant C Data is divided into 100 sec bins |
 |
 |
| Module-wise count rates for Quadrant D Data is divided into 100 sec bins |
 |
 |
| Parameter | Plot |
|---|---|
| CZT HV Monitor |  |
| D_VDD |  |
| Temperature 1 |  |
| Veto HV Monitor |  |
| Veto LLD |  |
| Alpha Counter |  |
| _CPM_Rate |  |
| CZT Counter |  |
| +2.5 Volts monitor |  |
| +5 Volts monitor |  |
| _ROLL_ROT |  |
| _Roll_DEC |  |
| _Roll_RA |  |
| Veto Counter |  |