| Param | Original file | Final file |
|---|---|---|
| Filename | modeM0/AS1A05_012T01_9000002918cztM0_level2_bc.evt | modeM0/AS1A05_012T01_9000002918cztM0_level2_quad_clean.evt |
| Size (bytes) | 851,114,880 | 276,707,520 |
| Size | 811.7 MB | 263.9 MB |
| Events in quadrant A | 4,720,918 | 1,756,292 |
| Events in quadrant B | 6,657,281 | 1,743,000 |
| Events in quadrant C | 4,665,860 | 1,686,608 |
| Events in quadrant D | 8,183,003 | 1,636,556 |
| Mode M0 | |||
|---|---|---|---|
| Quadrant | BADHDUFLAG | Total packets | Discarded packets |
| A | 0 | 48164 | 0 |
| B | 0 | 54776 | 0 |
| C | 0 | 47885 | 0 |
| D | 0 | 60535 | 0 |
| Mode SS | |||
|---|---|---|---|
| Quadrant | BADHDUFLAG | Total packets | Discarded packets |
| A | 0 | 458 | 0 |
| B | 0 | 458 | 0 |
| C | 0 | 458 | 0 |
| D | 0 | 458 | 0 |
| Mode M9 | |||
|---|---|---|---|
| Quadrant | BADHDUFLAG | Total packets | Discarded packets |
| A | 0 | 13 | 0 |
| B | 0 | 13 | 0 |
| C | 0 | 13 | 0 |
| D | 0 | 13 | 0 |
| Quadrant | Total seconds | Saturated seconds | Saturation percentage |
|---|---|---|---|
| A | 22636 | 792 | 3.498851% |
| B | 22636 | 1151 | 5.084821% |
| C | 22636 | 834 | 3.684397% |
| D | 22636 | 1288 | 5.690051% |
Noise dominated data is calculated using 1-second bins in cleaned event files. If a bin has >2000 counts, and if more than 50% of those come from <1% of pixels, then it is considered to be noise-dominated and hence unusable.
| Quadrant | # 1 sec bins | Bins with >0 counts | Bins with >2000 counts | High rate bins dominated by noise | Noise dominated (total time) | Noise dominated (detector-on time) | Marked lightcurve |
|---|---|---|---|---|---|---|---|
| A | 27818 | 22636 | 8 | 8 | 0.03% | 0.04% |  |
| B | 27817 | 22636 | 63 | 63 | 0.23% | 0.28% |  |
| C | 27817 | 22637 | 0 | 0 | 0.00% | 0.00% | 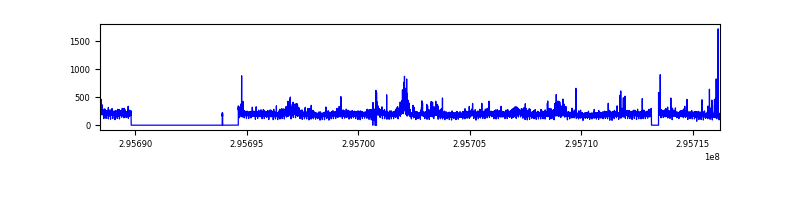 |
| D | 27818 | 22637 | 101 | 101 | 0.36% | 0.45% |  |
Top three noisy pixels from each quadrant. If the there are fewer than three noisy pixels in the level2.evt file, extra rows are filled as -1
| Pixel properties | Quadrant properties | ||||||
|---|---|---|---|---|---|---|---|
| Quadrant | DetID | PixID | Counts | Sigma | Mean | Median | Sigma |
| A | 5 | 16 | 271440 | 1064.0 | 1149 | 1123 | 254.1 |
| A | 13 | 254 | 18767 | 69.45 | 1149 | 1123 | 254.1 |
| A | 11 | 29 | 15183 | 55.34 | 1149 | 1123 | 254.1 |
| B | 3 | 112 | 1754831 | 7920.18 | 1147 | 1115 | 221.4 |
| B | 7 | 220 | 194212 | 872.07 | 1147 | 1115 | 221.4 |
| B | 0 | 198 | 54657 | 241.81 | 1147 | 1115 | 221.4 |
| C | 3 | 233 | 297391 | 1146.4 | 1100 | 1089 | 258.5 |
| C | 7 | 247 | 71853 | 273.79 | 1100 | 1089 | 258.5 |
| C | 5 | 112 | 25903 | 96.01 | 1100 | 1089 | 258.5 |
| D | 1 | 52 | 1744002 | 6610.88 | 1120 | 1077 | 263.6 |
| D | 7 | 238 | 902223 | 3418.03 | 1120 | 1077 | 263.6 |
| D | 1 | 20 | 670555 | 2539.32 | 1120 | 1077 | 263.6 |
Histogram calculated using DETX and DETY for each event in the final _common_clean file
| Quadrant A |  |
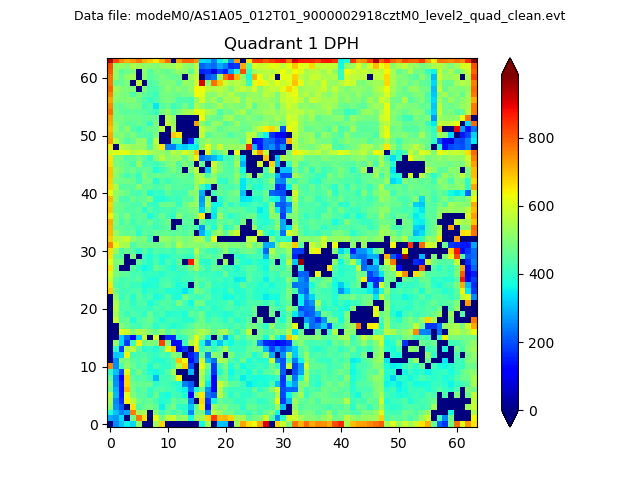 |
Quadrant B |
|---|---|---|---|
| Quadrant D |  |
 |
Quadrant C |
| Plot type | Count rate plots | Images |
|---|---|---|
| Comparison with Poisson distribution Blue bars denote a histogram of data divided into 1 sec bins. Red curve is a Poisson curve with rate = median count rate of data. |
 |
 |
| Quadrant-wise count rates Data is divided into 100 sec bins |
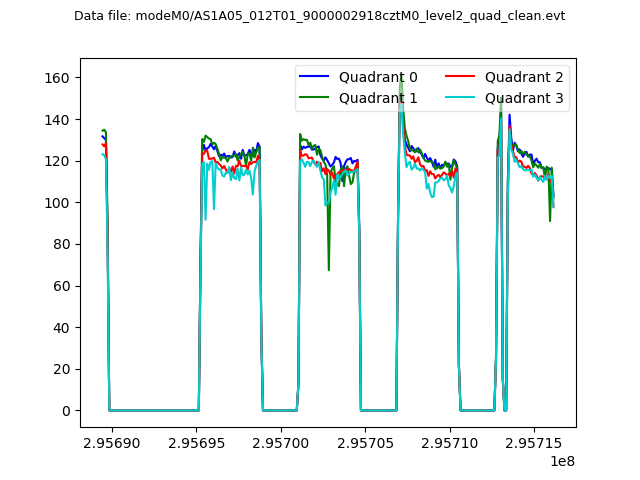 |
|
| Module-wise count rates for Quadrant A Data is divided into 100 sec bins |
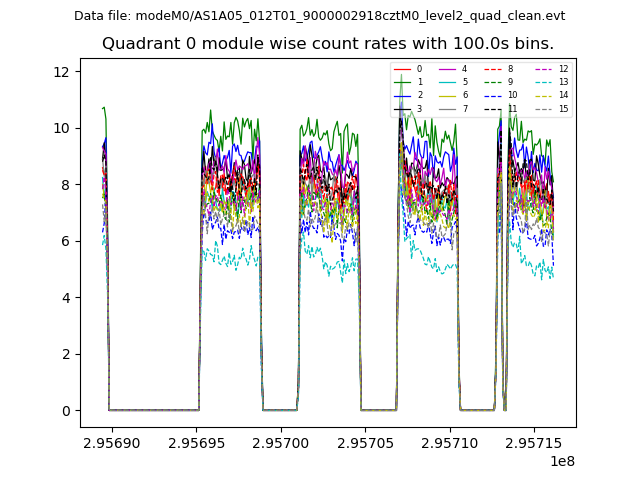 |
 |
| Module-wise count rates for Quadrant B Data is divided into 100 sec bins |
 |
 |
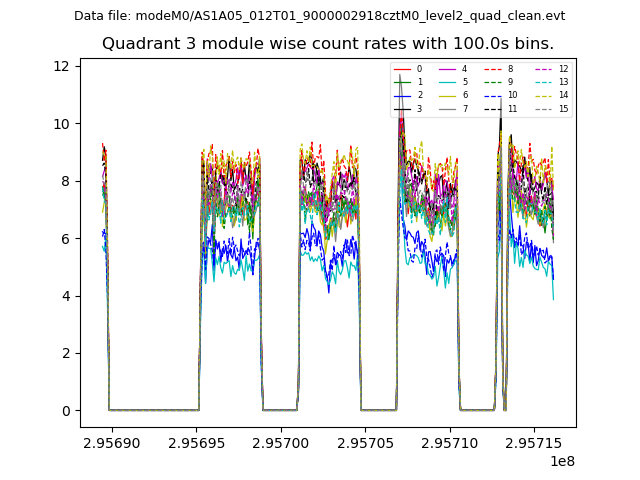
| Module-wise count rates for Quadrant C Data is divided into 100 sec bins |
 |
 |
| Module-wise count rates for Quadrant D Data is divided into 100 sec bins |
 |
 |
| Parameter | Plot |
|---|---|
| CZT HV Monitor |  |
| D_VDD |  |
| Temperature 1 |  |
| Veto HV Monitor |  |
| Veto LLD |  |
| Alpha Counter |  |
| _CPM_Rate |  |
| CZT Counter |  |
| +2.5 Volts monitor |  |
| +5 Volts monitor | 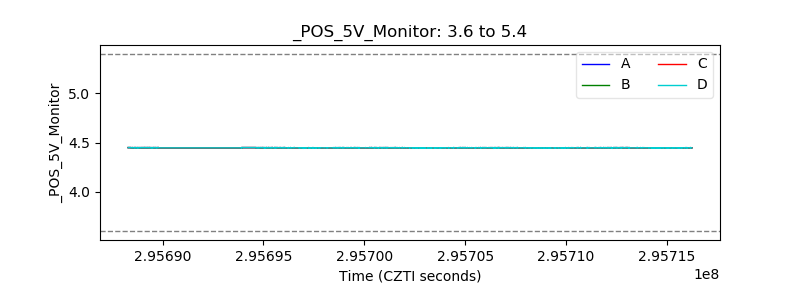 |
| _ROLL_ROT | 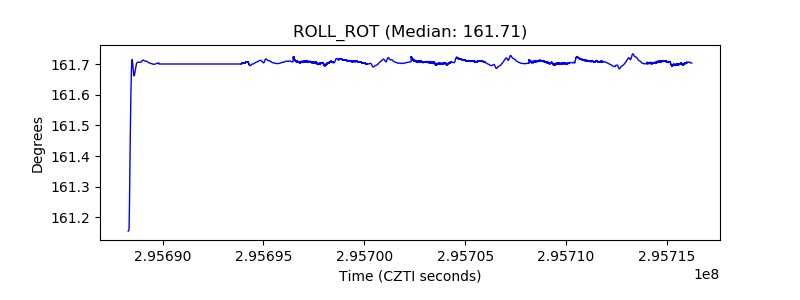 |
| _Roll_DEC |  |
| _Roll_RA | 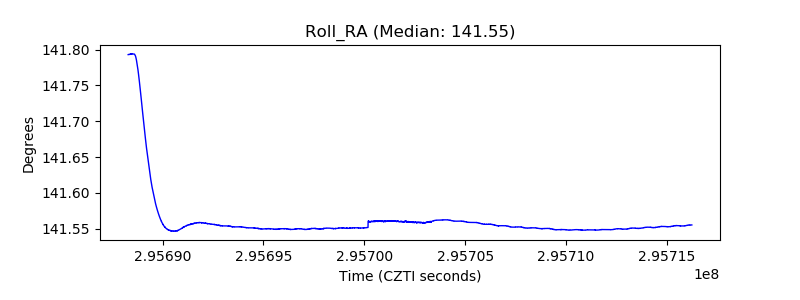 |
| Veto Counter |  |