| Param | Original file | Final file |
|---|---|---|
| Filename | modeM0/AS1T03_116T01_9000002916cztM0_level2_bc.evt | modeM0/AS1T03_116T01_9000002916cztM0_level2_quad_clean.evt |
| Size (bytes) | 3,626,853,120 | 1,162,488,960 |
| Size | 3.4 GB | 1.1 GB |
| Events in quadrant A | 19,374,552 | 7,456,131 |
| Events in quadrant B | 20,283,036 | 7,549,038 |
| Events in quadrant C | 19,852,103 | 7,185,368 |
| Events in quadrant D | 44,199,336 | 6,848,060 |
| Mode SS | |||
|---|---|---|---|
| Quadrant | BADHDUFLAG | Total packets | Discarded packets |
| A | 0 | 1828 | 0 |
| B | 0 | 1828 | 0 |
| C | 0 | 1828 | 0 |
| D | 0 | 1828 | 0 |
| Mode M0 | |||
|---|---|---|---|
| Quadrant | BADHDUFLAG | Total packets | Discarded packets |
| A | 0 | 187359 | 0 |
| B | 0 | 191013 | 0 |
| C | 0 | 192256 | 0 |
| D | 0 | 280828 | 0 |
| Mode M9 | |||
|---|---|---|---|
| Quadrant | BADHDUFLAG | Total packets | Discarded packets |
| A | 0 | 151 | 0 |
| B | 0 | 151 | 0 |
| C | 0 | 151 | 0 |
| D | 0 | 151 | 0 |
| Quadrant | Total seconds | Saturated seconds | Saturation percentage |
|---|---|---|---|
| A | 90048 | 1006 | 1.117182% |
| B | 90048 | 1391 | 1.544732% |
| C | 90048 | 1635 | 1.815698% |
| D | 90048 | 7372 | 8.186745% |
Noise dominated data is calculated using 1-second bins in cleaned event files. If a bin has >2000 counts, and if more than 50% of those come from <1% of pixels, then it is considered to be noise-dominated and hence unusable.
| Quadrant | # 1 sec bins | Bins with >0 counts | Bins with >2000 counts | High rate bins dominated by noise | Noise dominated (total time) | Noise dominated (detector-on time) | Marked lightcurve |
|---|---|---|---|---|---|---|---|
| A | 104907 | 90041 | 2 | 2 | 0.00% | 0.00% | 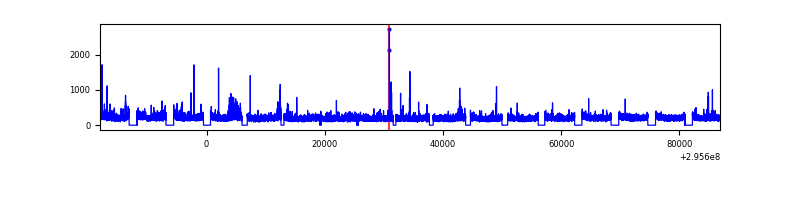 |
| B | 104907 | 90041 | 23 | 23 | 0.02% | 0.03% |  |
| C | 104907 | 90042 | 3 | 3 | 0.00% | 0.00% |  |
| D | 104907 | 90039 | 912 | 912 | 0.87% | 1.01% |  |
Top three noisy pixels from each quadrant. If the there are fewer than three noisy pixels in the level2.evt file, extra rows are filled as -1
| Pixel properties | Quadrant properties | ||||||
|---|---|---|---|---|---|---|---|
| Quadrant | DetID | PixID | Counts | Sigma | Mean | Median | Sigma |
| A | 11 | 47 | 208906 | 191.87 | 4905 | 4816 | 1063.7 |
| A | 9 | 143 | 126217 | 114.13 | 4905 | 4816 | 1063.7 |
| A | 11 | 29 | 95365 | 85.13 | 4905 | 4816 | 1063.7 |
| B | 7 | 220 | 422919 | 451.28 | 4930 | 4806 | 926.5 |
| B | 3 | 64 | 194995 | 205.27 | 4930 | 4806 | 926.5 |
| B | 4 | 216 | 179227 | 188.26 | 4930 | 4806 | 926.5 |
| C | 3 | 233 | 1493849 | 1361.65 | 4677 | 4666 | 1093.7 |
| C | 9 | 15 | 171970 | 152.98 | 4677 | 4666 | 1093.7 |
| C | 10 | 223 | 116445 | 102.21 | 4677 | 4666 | 1093.7 |
| D | 7 | 238 | 11625160 | 10786.53 | 4649 | 4490 | 1077.3 |
| D | 1 | 52 | 9465080 | 8781.5 | 4649 | 4490 | 1077.3 |
| D | 12 | 218 | 3880852 | 3598.11 | 4649 | 4490 | 1077.3 |
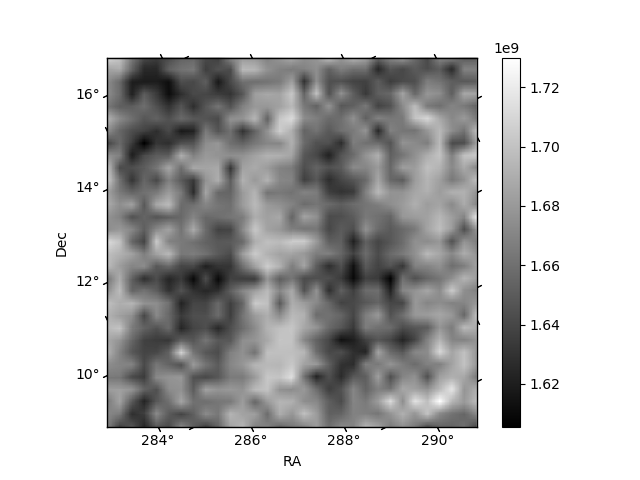
Histogram calculated using DETX and DETY for each event in the final _common_clean file
| Quadrant A |  |
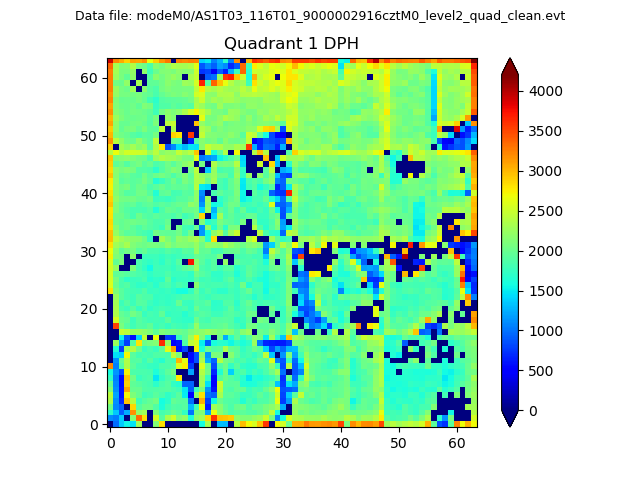 |
Quadrant B |
|---|---|---|---|
| Quadrant D |  |
 |
Quadrant C |
| Plot type | Count rate plots | Images |
|---|---|---|
| Comparison with Poisson distribution Blue bars denote a histogram of data divided into 1 sec bins. Red curve is a Poisson curve with rate = median count rate of data. |
 |
 |
| Quadrant-wise count rates Data is divided into 100 sec bins |
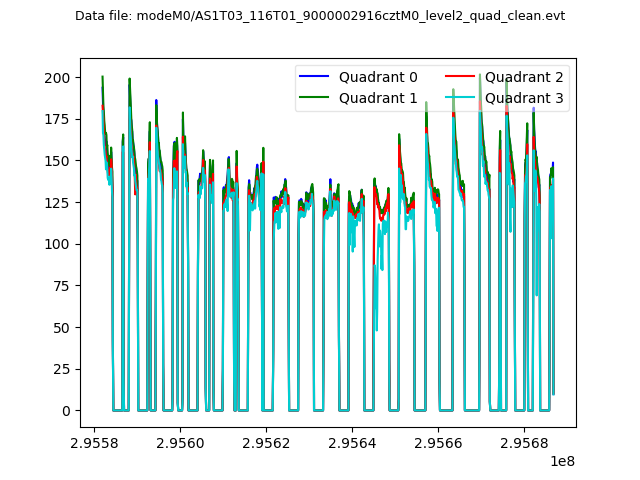 |
|
| Module-wise count rates for Quadrant A Data is divided into 100 sec bins |
 |
 |
| Module-wise count rates for Quadrant B Data is divided into 100 sec bins |
 |
 |
| Module-wise count rates for Quadrant C Data is divided into 100 sec bins |
 |
 |
| Module-wise count rates for Quadrant D Data is divided into 100 sec bins |
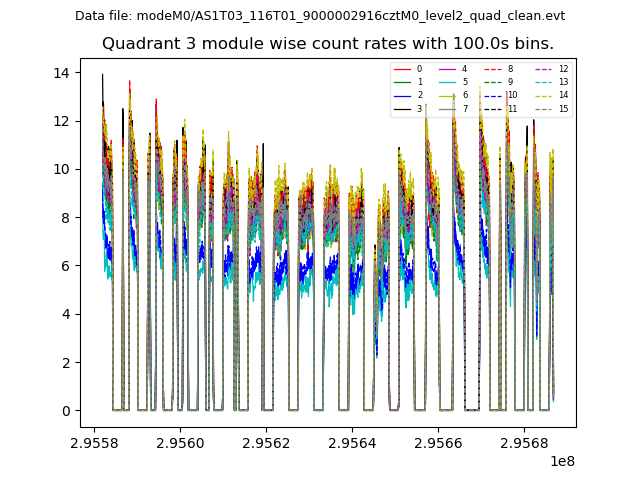 |
 |
| Parameter | Plot |
|---|---|
| CZT HV Monitor |  |
| D_VDD |  |
| Temperature 1 | 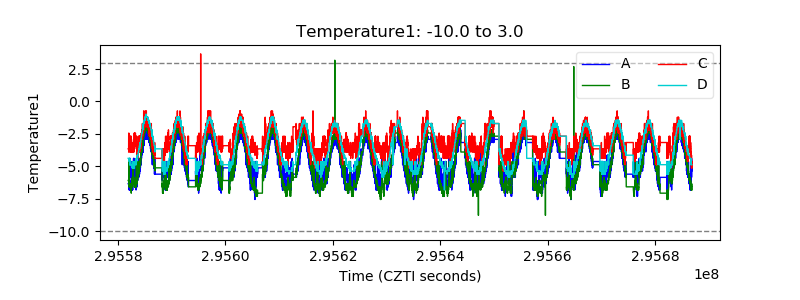 |
| Veto HV Monitor | 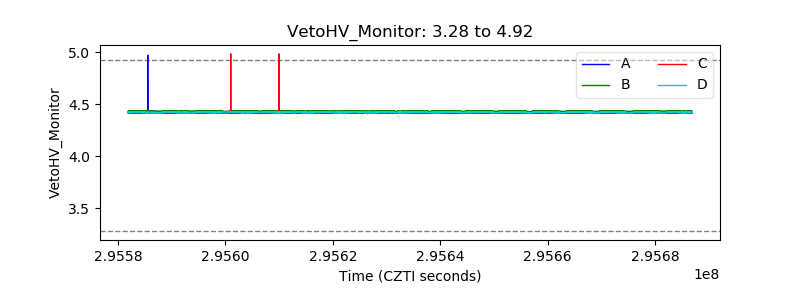 |
| Veto LLD |  |
| Alpha Counter |  |
| _CPM_Rate |  |
| CZT Counter |  |
| +2.5 Volts monitor |  |
| +5 Volts monitor |  |
| _ROLL_ROT |  |
| _Roll_DEC |  |
| _Roll_RA |  |
| Veto Counter |  |