| Param | Original file | Final file |
|---|---|---|
| Filename | modeM0/AS1A05_104T08_9000002910cztM0_level2_bc.evt | modeM0/AS1A05_104T08_9000002910cztM0_level2_quad_clean.evt |
| Size (bytes) | 594,187,200 | 191,018,880 |
| Size | 566.7 MB | 182.2 MB |
| Events in quadrant A | 3,482,727 | 1,168,066 |
| Events in quadrant B | 3,595,624 | 1,177,303 |
| Events in quadrant C | 3,694,708 | 1,117,207 |
| Events in quadrant D | 5,988,175 | 1,081,565 |
| Mode SS | |||
|---|---|---|---|
| Quadrant | BADHDUFLAG | Total packets | Discarded packets |
| A | 0 | 368 | 0 |
| B | 0 | 368 | 0 |
| C | 0 | 368 | 0 |
| D | 0 | 368 | 0 |
| Mode M0 | |||
|---|---|---|---|
| Quadrant | BADHDUFLAG | Total packets | Discarded packets |
| A | 0 | 36715 | 0 |
| B | 0 | 37081 | 0 |
| C | 0 | 37913 | 0 |
| D | 0 | 43930 | 0 |
| Mode M9 | |||
|---|---|---|---|
| Quadrant | BADHDUFLAG | Total packets | Discarded packets |
| A | 0 | 21 | 0 |
| B | 0 | 21 | 0 |
| C | 0 | 21 | 0 |
| D | 0 | 21 | 0 |
| Quadrant | Total seconds | Saturated seconds | Saturation percentage |
|---|---|---|---|
| A | 17995 | 98 | 0.544596% |
| B | 17995 | 115 | 0.639066% |
| C | 17995 | 257 | 1.428174% |
| D | 17995 | 532 | 2.956377% |
Noise dominated data is calculated using 1-second bins in cleaned event files. If a bin has >2000 counts, and if more than 50% of those come from <1% of pixels, then it is considered to be noise-dominated and hence unusable.
| Quadrant | # 1 sec bins | Bins with >0 counts | Bins with >2000 counts | High rate bins dominated by noise | Noise dominated (total time) | Noise dominated (detector-on time) | Marked lightcurve |
|---|---|---|---|---|---|---|---|
| A | 20135 | 17994 | 0 | 0 | 0.00% | 0.00% |  |
| B | 20135 | 17993 | 2 | 2 | 0.01% | 0.01% |  |
| C | 20135 | 17994 | 0 | 0 | 0.00% | 0.00% |  |
| D | 20135 | 17995 | 125 | 125 | 0.62% | 0.69% |  |
Top three noisy pixels from each quadrant. If the there are fewer than three noisy pixels in the level2.evt file, extra rows are filled as -1
| Pixel properties | Quadrant properties | ||||||
|---|---|---|---|---|---|---|---|
| Quadrant | DetID | PixID | Counts | Sigma | Mean | Median | Sigma |
| A | 13 | 254 | 25608 | 124.3 | 894 | 874 | 199.0 |
| A | 9 | 143 | 20010 | 96.17 | 894 | 874 | 199.0 |
| A | 5 | 16 | 7778 | 34.7 | 894 | 874 | 199.0 |
| B | 0 | 198 | 31867 | 178.96 | 899 | 875 | 173.2 |
| B | 7 | 220 | 20924 | 115.77 | 899 | 875 | 173.2 |
| B | 15 | 19 | 20681 | 114.37 | 899 | 875 | 173.2 |
| C | 3 | 233 | 237221 | 1165.7 | 856 | 850 | 202.8 |
| C | 7 | 247 | 79101 | 385.91 | 856 | 850 | 202.8 |
| C | 5 | 112 | 41002 | 198.02 | 856 | 850 | 202.8 |
| D | 1 | 52 | 1351039 | 6626.24 | 869 | 835 | 203.8 |
| D | 7 | 238 | 505509 | 2476.73 | 869 | 835 | 203.8 |
| D | 12 | 218 | 403719 | 1977.19 | 869 | 835 | 203.8 |
Histogram calculated using DETX and DETY for each event in the final _common_clean file
| Quadrant A |  |
 |
Quadrant B |
|---|---|---|---|
| Quadrant D |  |
 |
Quadrant C |
| Plot type | Count rate plots | Images |
|---|---|---|
| Comparison with Poisson distribution Blue bars denote a histogram of data divided into 1 sec bins. Red curve is a Poisson curve with rate = median count rate of data. |
 |
 |
| Quadrant-wise count rates Data is divided into 100 sec bins |
 |
|
| Module-wise count rates for Quadrant A Data is divided into 100 sec bins |
 |
 |
| Module-wise count rates for Quadrant B Data is divided into 100 sec bins |
 |
 |
| Module-wise count rates for Quadrant C Data is divided into 100 sec bins |
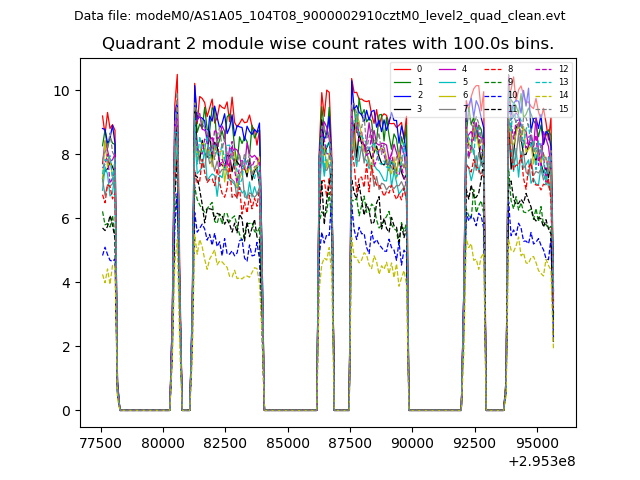 |
 |
| Module-wise count rates for Quadrant D Data is divided into 100 sec bins |
 |
 |
| Parameter | Plot |
|---|---|
| CZT HV Monitor |  |
| D_VDD |  |
| Temperature 1 |  |
| Veto HV Monitor | 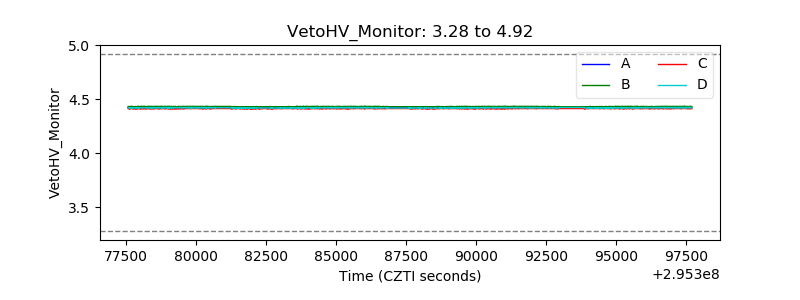 |
| Veto LLD |  |
| Alpha Counter |  |
| _CPM_Rate |  |
| CZT Counter |  |
| +2.5 Volts monitor | 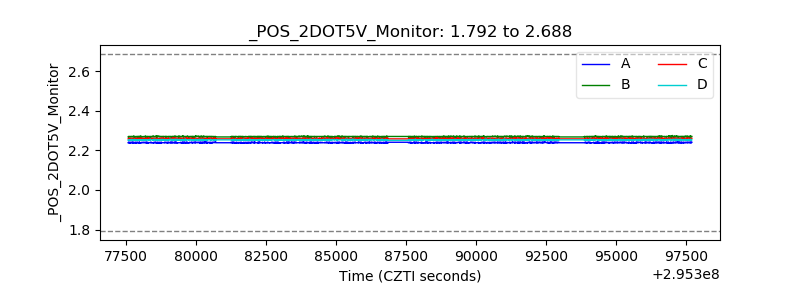 |
| +5 Volts monitor |  |
| _ROLL_ROT |  |
| _Roll_DEC |  |
| _Roll_RA |  |
| Veto Counter |  |