| Param | Original file | Final file |
|---|---|---|
| Filename | modeM0/AS1A05_115T02_9000002906cztM0_level2_bc.evt | modeM0/AS1A05_115T02_9000002906cztM0_level2_quad_clean.evt |
| Size (bytes) | 2,263,587,840 | 838,664,640 |
| Size | 2.1 GB | 799.8 MB |
| Events in quadrant A | 14,505,390 | 5,370,240 |
| Events in quadrant B | 14,665,619 | 5,421,460 |
| Events in quadrant C | 15,404,500 | 5,098,076 |
| Events in quadrant D | 19,495,226 | 5,004,113 |
| Mode M0 | |||
|---|---|---|---|
| Quadrant | BADHDUFLAG | Total packets | Discarded packets |
| A | 0 | 137047 | 0 |
| B | 0 | 138929 | 0 |
| C | 0 | 142437 | 0 |
| D | 0 | 154704 | 0 |
| Mode M9 | |||
|---|---|---|---|
| Quadrant | BADHDUFLAG | Total packets | Discarded packets |
| A | 0 | 108 | 0 |
| B | 0 | 108 | 0 |
| C | 0 | 108 | 0 |
| D | 0 | 108 | 0 |
| Mode SS | |||
|---|---|---|---|
| Quadrant | BADHDUFLAG | Total packets | Discarded packets |
| A | 0 | 1340 | 0 |
| B | 0 | 1340 | 0 |
| C | 0 | 1340 | 0 |
| D | 0 | 1340 | 0 |
| Quadrant | Total seconds | Saturated seconds | Saturation percentage |
|---|---|---|---|
| A | 65763 | 803 | 1.221051% |
| B | 65763 | 1023 | 1.555586% |
| C | 65763 | 1230 | 1.870353% |
| D | 65763 | 1296 | 1.970713% |
Noise dominated data is calculated using 1-second bins in cleaned event files. If a bin has >2000 counts, and if more than 50% of those come from <1% of pixels, then it is considered to be noise-dominated and hence unusable.
| Quadrant | # 1 sec bins | Bins with >0 counts | Bins with >2000 counts | High rate bins dominated by noise | Noise dominated (total time) | Noise dominated (detector-on time) | Marked lightcurve |
|---|---|---|---|---|---|---|---|
| A | 76398 | 65761 | 1 | 1 | 0.00% | 0.00% | 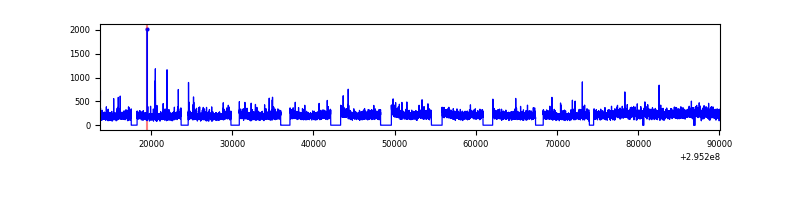 |
| B | 76398 | 65756 | 21 | 21 | 0.03% | 0.03% | 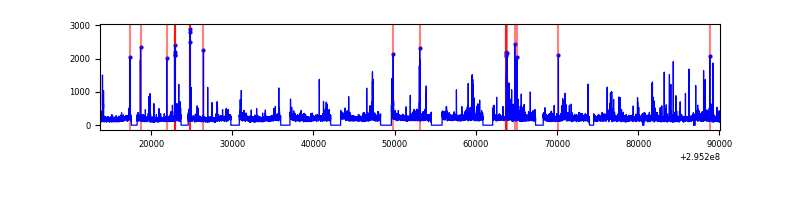 |
| C | 76398 | 65762 | 14 | 14 | 0.02% | 0.02% |  |
| D | 76398 | 65760 | 123 | 123 | 0.16% | 0.19% |  |
Top three noisy pixels from each quadrant. If the there are fewer than three noisy pixels in the level2.evt file, extra rows are filled as -1
| Pixel properties | Quadrant properties | ||||||
|---|---|---|---|---|---|---|---|
| Quadrant | DetID | PixID | Counts | Sigma | Mean | Median | Sigma |
| A | 15 | 191 | 773164 | 1003.94 | 3528 | 3459 | 766.7 |
| A | 9 | 143 | 111849 | 141.37 | 3528 | 3459 | 766.7 |
| A | 13 | 254 | 87411 | 109.5 | 3528 | 3459 | 766.7 |
| B | 3 | 64 | 315556 | 471.61 | 3545 | 3461 | 661.8 |
| B | 7 | 220 | 191898 | 284.75 | 3545 | 3461 | 661.8 |
| B | 0 | 198 | 176960 | 262.18 | 3545 | 3461 | 661.8 |
| C | 3 | 233 | 1518500 | 1939.15 | 3352 | 3339 | 781.4 |
| C | 7 | 247 | 750974 | 956.85 | 3352 | 3339 | 781.4 |
| C | 9 | 221 | 126666 | 157.84 | 3352 | 3339 | 781.4 |
| D | 1 | 52 | 1547393 | 1974.13 | 3423 | 3305 | 782.2 |
| D | 7 | 238 | 1392499 | 1776.1 | 3423 | 3305 | 782.2 |
| D | 12 | 233 | 1217613 | 1552.5 | 3423 | 3305 | 782.2 |
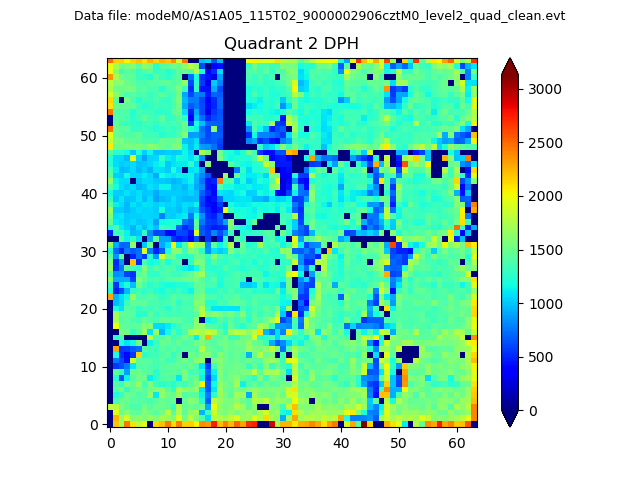
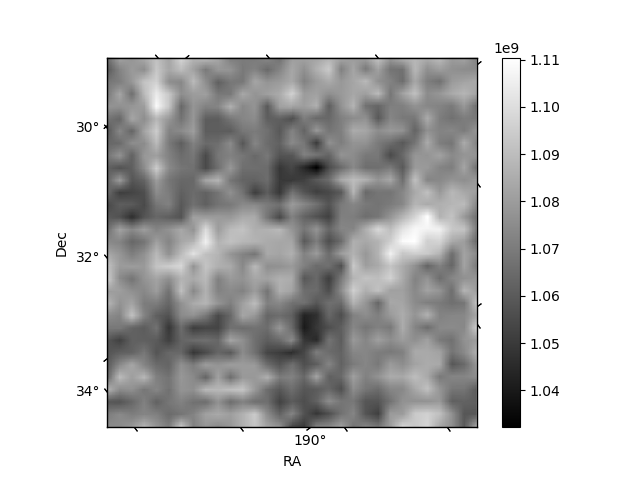
Histogram calculated using DETX and DETY for each event in the final _common_clean file
| Quadrant A | 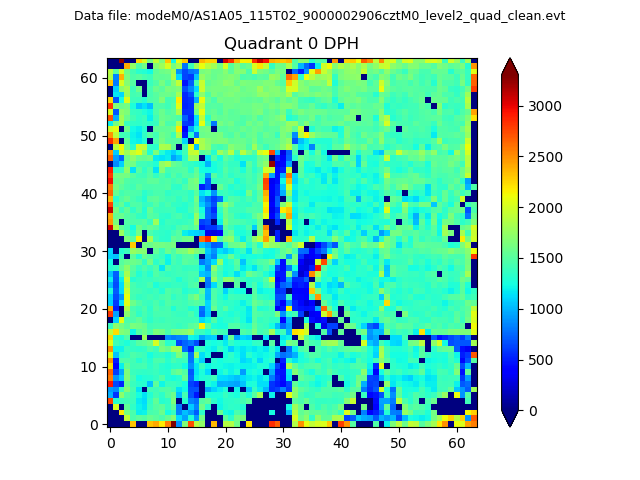 |
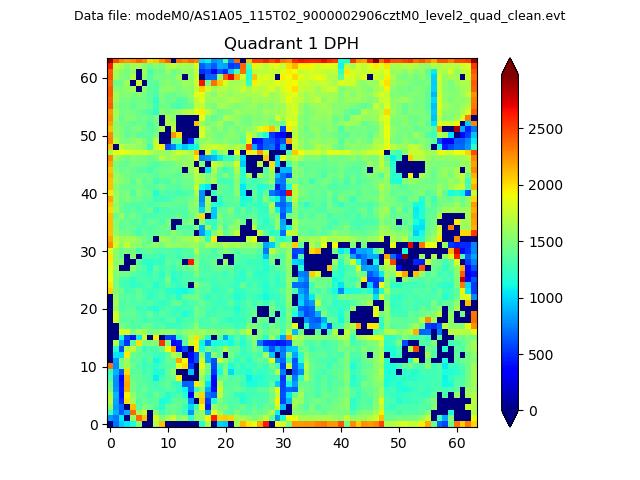 |
Quadrant B |
|---|---|---|---|
| Quadrant D | 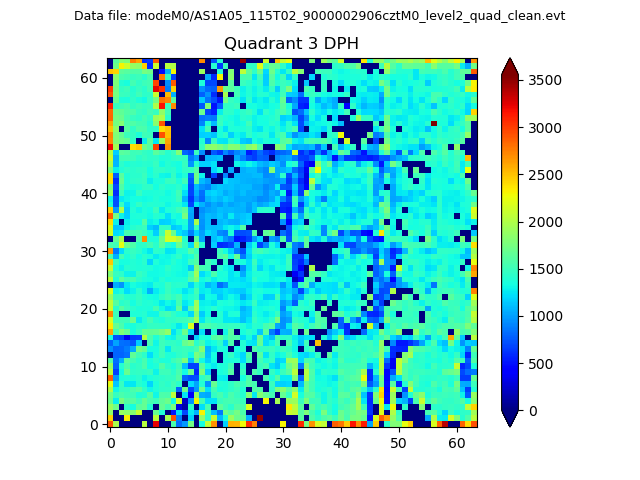 |
 |
Quadrant C |
| Plot type | Count rate plots | Images |
|---|---|---|
| Comparison with Poisson distribution Blue bars denote a histogram of data divided into 1 sec bins. Red curve is a Poisson curve with rate = median count rate of data. |
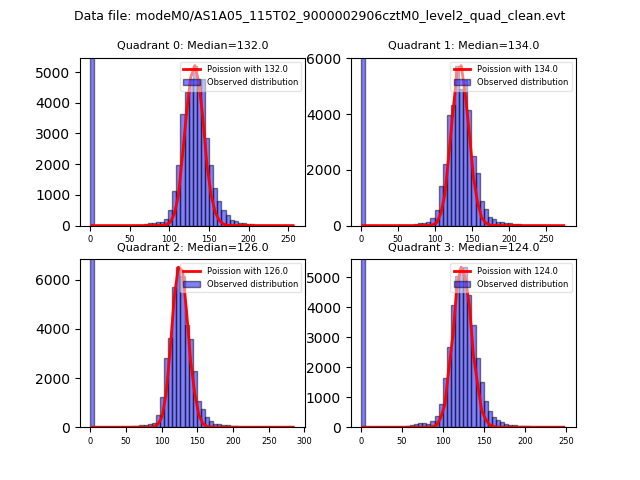 |
 |
| Quadrant-wise count rates Data is divided into 100 sec bins |
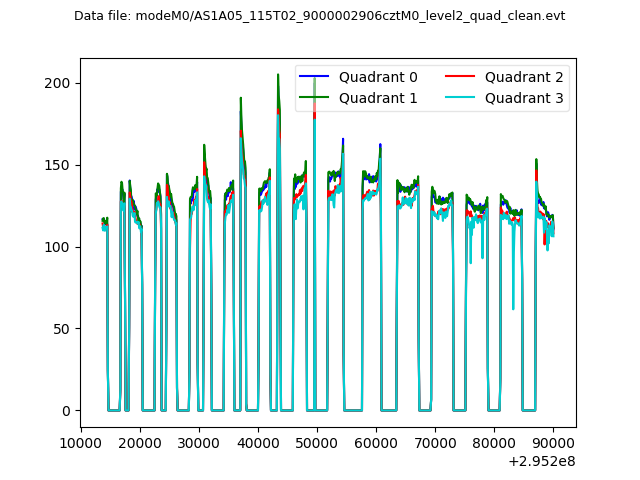 |
|
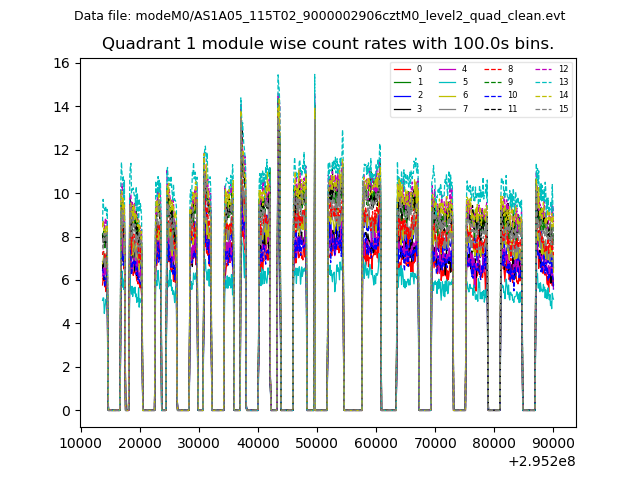
| Module-wise count rates for Quadrant A Data is divided into 100 sec bins |
 |
 |
| Module-wise count rates for Quadrant B Data is divided into 100 sec bins |
 |
 |
| Module-wise count rates for Quadrant C Data is divided into 100 sec bins |
 |
 |
| Module-wise count rates for Quadrant D Data is divided into 100 sec bins |
 |
 |
| Parameter | Plot |
|---|---|
| CZT HV Monitor |  |
| D_VDD |  |
| Temperature 1 | 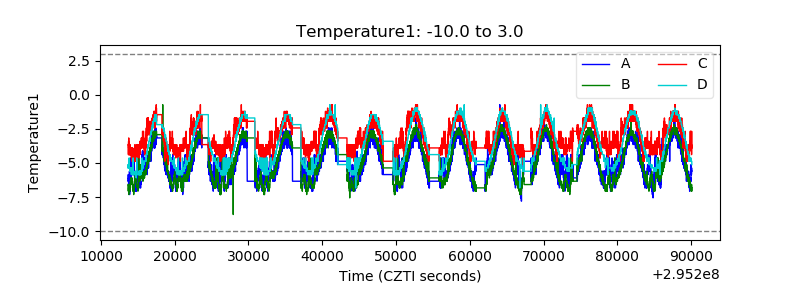 |
| Veto HV Monitor |  |
| Veto LLD |  |
| Alpha Counter | 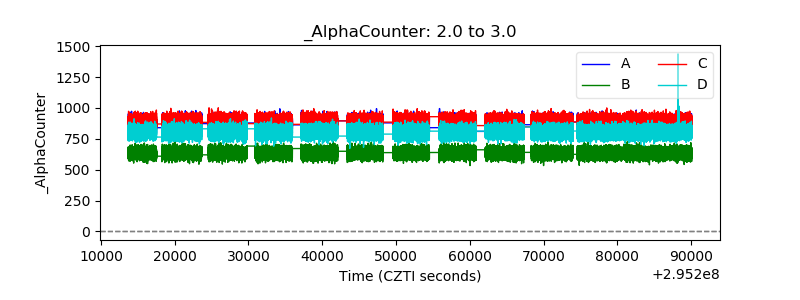 |
| _CPM_Rate |  |
| CZT Counter |  |
| +2.5 Volts monitor |  |
| +5 Volts monitor |  |
| _ROLL_ROT |  |
| _Roll_DEC |  |
| _Roll_RA |  |
| Veto Counter |  |