| Param | Original file | Final file |
|---|---|---|
| Filename | modeM0/AS1T03_108T01_9000002898cztM0_level2_bc.evt | modeM0/AS1T03_108T01_9000002898cztM0_level2_quad_clean.evt |
| Size (bytes) | 1,121,526,720 | 390,234,240 |
| Size | 1.0 GB | 372.2 MB |
| Events in quadrant A | 7,080,539 | 2,442,989 |
| Events in quadrant B | 7,514,974 | 2,459,252 |
| Events in quadrant C | 7,307,211 | 2,373,125 |
| Events in quadrant D | 9,859,683 | 2,327,789 |
| Mode M0 | |||
|---|---|---|---|
| Quadrant | BADHDUFLAG | Total packets | Discarded packets |
| A | 0 | 67416 | 0 |
| B | 0 | 69086 | 0 |
| C | 0 | 68694 | 0 |
| D | 0 | 76450 | 0 |
| Mode SS | |||
|---|---|---|---|
| Quadrant | BADHDUFLAG | Total packets | Discarded packets |
| A | 0 | 654 | 0 |
| B | 0 | 654 | 0 |
| C | 0 | 654 | 0 |
| D | 0 | 654 | 0 |
| Mode M9 | |||
|---|---|---|---|
| Quadrant | BADHDUFLAG | Total packets | Discarded packets |
| A | 0 | 60 | 0 |
| B | 0 | 60 | 0 |
| C | 0 | 60 | 0 |
| D | 0 | 60 | 0 |
| Quadrant | Total seconds | Saturated seconds | Saturation percentage |
|---|---|---|---|
| A | 32260 | 483 | 1.497210% |
| B | 32260 | 637 | 1.974582% |
| C | 32260 | 632 | 1.959082% |
| D | 32260 | 938 | 2.907626% |
Noise dominated data is calculated using 1-second bins in cleaned event files. If a bin has >2000 counts, and if more than 50% of those come from <1% of pixels, then it is considered to be noise-dominated and hence unusable.
| Quadrant | # 1 sec bins | Bins with >0 counts | Bins with >2000 counts | High rate bins dominated by noise | Noise dominated (total time) | Noise dominated (detector-on time) | Marked lightcurve |
|---|---|---|---|---|---|---|---|
| A | 38105 | 32257 | 0 | 0 | 0.00% | 0.00% |  |
| B | 38105 | 32257 | 6 | 6 | 0.02% | 0.02% |  |
| C | 38105 | 32262 | 1 | 1 | 0.00% | 0.00% |  |
| D | 38105 | 32259 | 187 | 187 | 0.49% | 0.58% |  |
Top three noisy pixels from each quadrant. If the there are fewer than three noisy pixels in the level2.evt file, extra rows are filled as -1
| Pixel properties | Quadrant properties | ||||||
|---|---|---|---|---|---|---|---|
| Quadrant | DetID | PixID | Counts | Sigma | Mean | Median | Sigma |
| A | 13 | 254 | 40914 | 100.44 | 1818 | 1784 | 389.6 |
| A | 12 | 96 | 21309 | 50.12 | 1818 | 1784 | 389.6 |
| A | 12 | 16 | 17105 | 39.33 | 1818 | 1784 | 389.6 |
| B | 7 | 220 | 147831 | 434.22 | 1820 | 1779 | 336.4 |
| B | 0 | 244 | 129925 | 380.99 | 1820 | 1779 | 336.4 |
| B | 3 | 64 | 72173 | 209.29 | 1820 | 1779 | 336.4 |
| C | 3 | 233 | 501993 | 1243.1 | 1739 | 1733 | 402.4 |
| C | 9 | 221 | 49312 | 118.23 | 1739 | 1733 | 402.4 |
| C | 0 | 207 | 28004 | 65.28 | 1739 | 1733 | 402.4 |
| D | 13 | 104 | 820182 | 2021.75 | 1784 | 1724 | 404.8 |
| D | 12 | 233 | 722772 | 1781.13 | 1784 | 1724 | 404.8 |
| D | 1 | 52 | 629626 | 1551.04 | 1784 | 1724 | 404.8 |
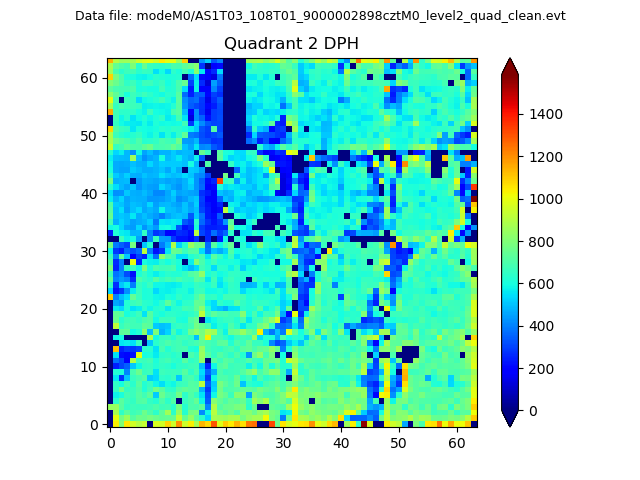
Histogram calculated using DETX and DETY for each event in the final _common_clean file
| Quadrant A | 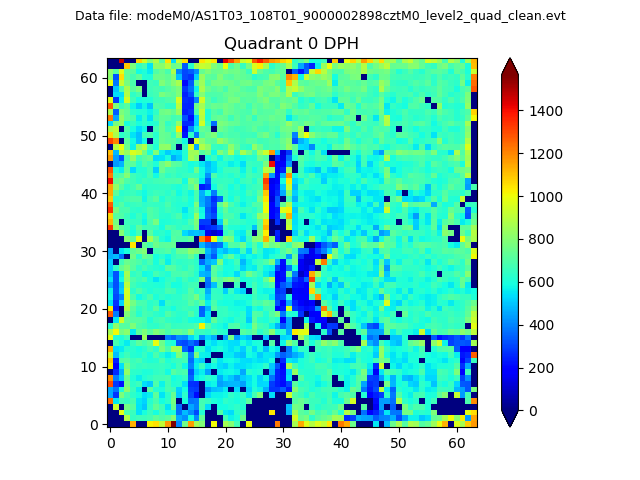 |
 |
Quadrant B |
|---|---|---|---|
| Quadrant D |  |
 |
Quadrant C |
| Plot type | Count rate plots | Images |
|---|---|---|
| Comparison with Poisson distribution Blue bars denote a histogram of data divided into 1 sec bins. Red curve is a Poisson curve with rate = median count rate of data. |
 |
 |
| Quadrant-wise count rates Data is divided into 100 sec bins |
 |
|
| Module-wise count rates for Quadrant A Data is divided into 100 sec bins |
 |
 |
| Module-wise count rates for Quadrant B Data is divided into 100 sec bins |
 |
 |
| Module-wise count rates for Quadrant C Data is divided into 100 sec bins |
 |
 |
| Module-wise count rates for Quadrant D Data is divided into 100 sec bins |
 |
 |
| Parameter | Plot |
|---|---|
| CZT HV Monitor | 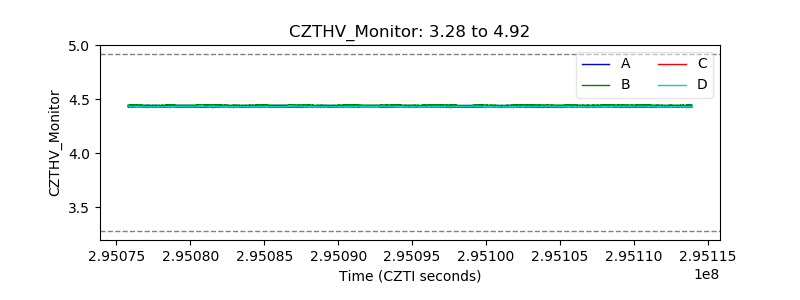 |
| D_VDD |  |
| Temperature 1 |  |
| Veto HV Monitor |  |
| Veto LLD | 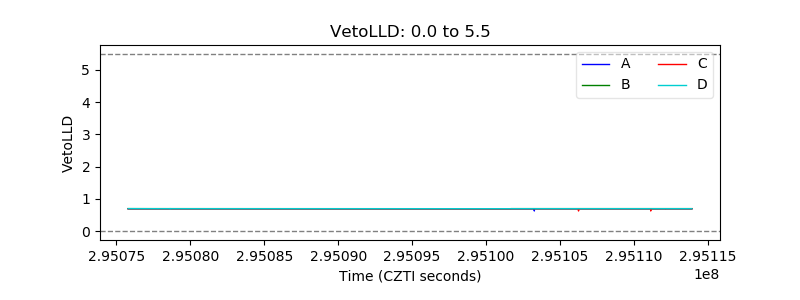 |
| Alpha Counter |  |
| _CPM_Rate | 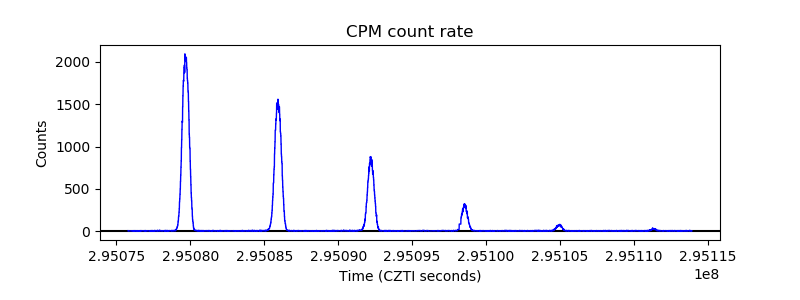 |
| CZT Counter | 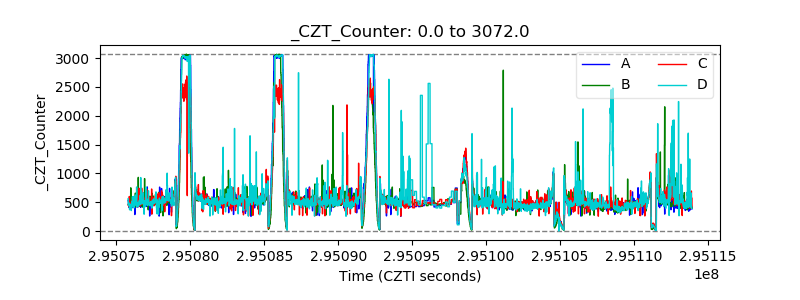 |
| +2.5 Volts monitor |  |
| +5 Volts monitor |  |
| _ROLL_ROT |  |
| _Roll_DEC |  |
| _Roll_RA |  |
| Veto Counter |  |