| Param | Original file | Final file |
|---|---|---|
| Filename | modeM0/AS1T03_056T01_9000002900cztM0_level2_bc.evt | modeM0/AS1T03_056T01_9000002900cztM0_level2_quad_clean.evt |
| Size (bytes) | 291,991,680 | 125,173,440 |
| Size | 278.5 MB | 119.4 MB |
| Events in quadrant A | 1,724,139 | 813,352 |
| Events in quadrant B | 1,887,423 | 818,634 |
| Events in quadrant C | 2,030,641 | 778,334 |
| Events in quadrant D | 2,598,548 | 775,449 |
| Mode SS | |||
|---|---|---|---|
| Quadrant | BADHDUFLAG | Total packets | Discarded packets |
| A | 0 | 176 | 0 |
| B | 0 | 176 | 0 |
| C | 0 | 176 | 0 |
| D | 0 | 176 | 0 |
| Mode M9 | |||
|---|---|---|---|
| Quadrant | BADHDUFLAG | Total packets | Discarded packets |
| A | 0 | 5 | 0 |
| B | 0 | 5 | 0 |
| C | 0 | 5 | 0 |
| D | 0 | 5 | 0 |
| Mode M0 | |||
|---|---|---|---|
| Quadrant | BADHDUFLAG | Total packets | Discarded packets |
| A | 0 | 17910 | 0 |
| B | 0 | 18529 | 0 |
| C | 0 | 18956 | 0 |
| D | 0 | 21300 | 0 |
| Quadrant | Total seconds | Saturated seconds | Saturation percentage |
|---|---|---|---|
| A | 8723 | 127 | 1.455921% |
| B | 8723 | 161 | 1.845695% |
| C | 8723 | 221 | 2.533532% |
| D | 8723 | 431 | 4.940961% |
Noise dominated data is calculated using 1-second bins in cleaned event files. If a bin has >2000 counts, and if more than 50% of those come from <1% of pixels, then it is considered to be noise-dominated and hence unusable.
| Quadrant | # 1 sec bins | Bins with >0 counts | Bins with >2000 counts | High rate bins dominated by noise | Noise dominated (total time) | Noise dominated (detector-on time) | Marked lightcurve |
|---|---|---|---|---|---|---|---|
| A | 9062 | 8722 | 0 | 0 | 0.00% | 0.00% | 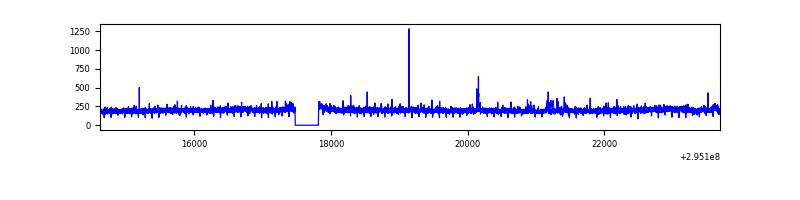 |
| B | 9062 | 8722 | 1 | 1 | 0.01% | 0.01% |  |
| C | 9062 | 8722 | 1 | 1 | 0.01% | 0.01% |  |
| D | 9061 | 8721 | 33 | 33 | 0.36% | 0.38% |  |
Top three noisy pixels from each quadrant. If the there are fewer than three noisy pixels in the level2.evt file, extra rows are filled as -1
| Pixel properties | Quadrant properties | ||||||
|---|---|---|---|---|---|---|---|
| Quadrant | DetID | PixID | Counts | Sigma | Mean | Median | Sigma |
| A | 12 | 16 | 10441 | 101.06 | 441 | 432 | 99.0 |
| A | 13 | 254 | 10185 | 98.47 | 441 | 432 | 99.0 |
| A | 15 | 192 | 5693 | 53.12 | 441 | 432 | 99.0 |
| B | 0 | 190 | 64701 | 730.23 | 442 | 429 | 88.0 |
| B | 7 | 220 | 22767 | 253.79 | 442 | 429 | 88.0 |
| B | 0 | 198 | 21850 | 243.37 | 442 | 429 | 88.0 |
| C | 3 | 233 | 381098 | 3754.45 | 420 | 415 | 101.4 |
| C | 10 | 223 | 14582 | 139.72 | 420 | 415 | 101.4 |
| C | 8 | 128 | 5700 | 52.12 | 420 | 415 | 101.4 |
| D | 12 | 233 | 374069 | 3686.23 | 426 | 408 | 101.4 |
| D | 12 | 218 | 362453 | 3571.63 | 426 | 408 | 101.4 |
| D | 1 | 52 | 66126 | 648.32 | 426 | 408 | 101.4 |
Histogram calculated using DETX and DETY for each event in the final _common_clean file
| Quadrant A | 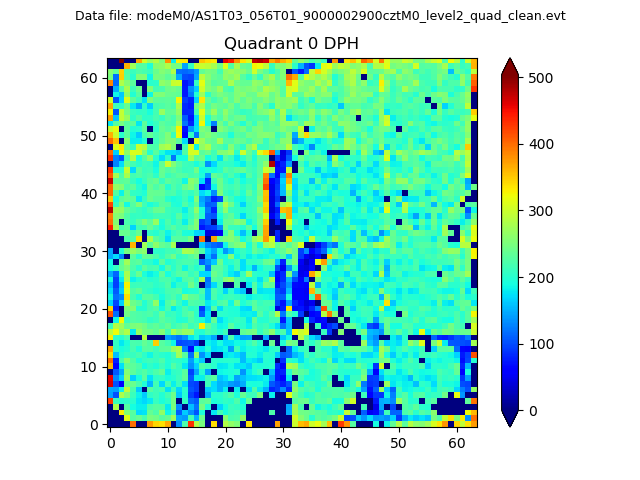 |
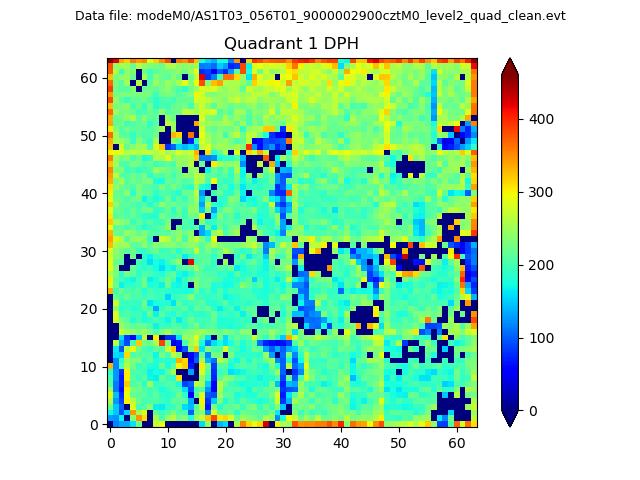 |
Quadrant B |
|---|---|---|---|
| Quadrant D | 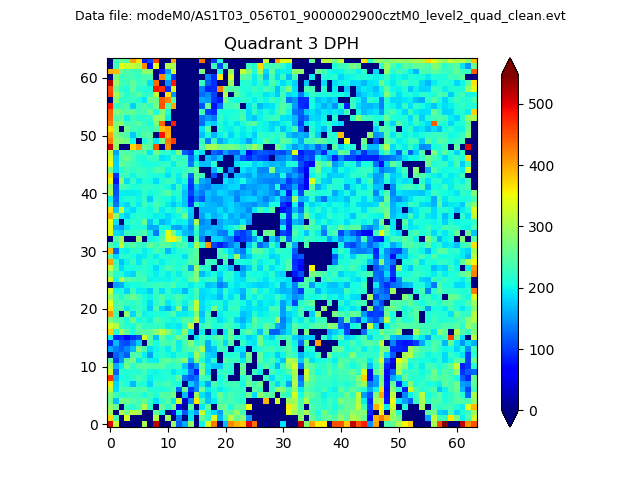 |
 |
Quadrant C |
| Plot type | Count rate plots | Images |
|---|---|---|
| Comparison with Poisson distribution Blue bars denote a histogram of data divided into 1 sec bins. Red curve is a Poisson curve with rate = median count rate of data. |
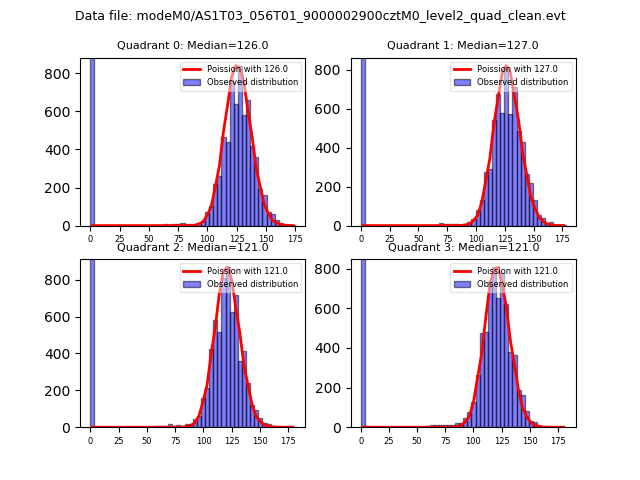 |
 |
| Quadrant-wise count rates Data is divided into 100 sec bins |
 |
|
| Module-wise count rates for Quadrant A Data is divided into 100 sec bins |
 |
 |
| Module-wise count rates for Quadrant B Data is divided into 100 sec bins |
 |
 |
| Module-wise count rates for Quadrant C Data is divided into 100 sec bins |
 |
 |
| Module-wise count rates for Quadrant D Data is divided into 100 sec bins |
 |
 |
| Parameter | Plot |
|---|---|
| CZT HV Monitor |  |
| D_VDD |  |
| Temperature 1 |  |
| Veto HV Monitor |  |
| Veto LLD | 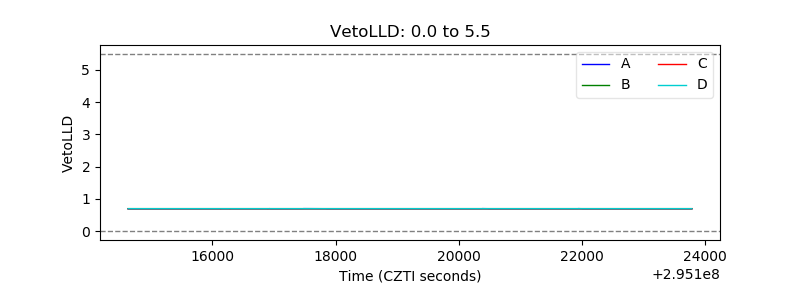 |
| Alpha Counter |  |
| _CPM_Rate |  |
| CZT Counter |  |
| +2.5 Volts monitor |  |
| +5 Volts monitor |  |
| _ROLL_ROT |  |
| _Roll_DEC |  |
| _Roll_RA |  |
| Veto Counter |  |