| Param | Original file | Final file |
|---|---|---|
| Filename | modeM0/AS1A05_101T05_9000002902cztM0_level2_bc.evt | modeM0/AS1A05_101T05_9000002902cztM0_level2_quad_clean.evt |
| Size (bytes) | 644,221,440 | 331,413,120 |
| Size | 614.4 MB | 316.1 MB |
| Events in quadrant A | 3,919,018 | 2,208,838 |
| Events in quadrant B | 4,224,327 | 2,227,559 |
| Events in quadrant C | 4,596,072 | 2,126,866 |
| Events in quadrant D | 5,400,038 | 2,097,115 |
| Mode SS | |||
|---|---|---|---|
| Quadrant | BADHDUFLAG | Total packets | Discarded packets |
| A | 0 | 408 | 0 |
| B | 0 | 408 | 0 |
| C | 0 | 408 | 0 |
| D | 0 | 408 | 0 |
| Mode M9 | |||
|---|---|---|---|
| Quadrant | BADHDUFLAG | Total packets | Discarded packets |
| A | 0 | 23 | 0 |
| B | 0 | 23 | 0 |
| C | 0 | 23 | 0 |
| D | 0 | 23 | 0 |
| Mode M0 | |||
|---|---|---|---|
| Quadrant | BADHDUFLAG | Total packets | Discarded packets |
| A | 0 | 40473 | 0 |
| B | 0 | 41363 | 0 |
| C | 0 | 42409 | 0 |
| D | 0 | 46823 | 0 |
| Quadrant | Total seconds | Saturated seconds | Saturation percentage |
|---|---|---|---|
| A | 20008 | 64 | 0.319872% |
| B | 20008 | 138 | 0.689724% |
| C | 20008 | 145 | 0.724710% |
| D | 20008 | 531 | 2.653938% |
Noise dominated data is calculated using 1-second bins in cleaned event files. If a bin has >2000 counts, and if more than 50% of those come from <1% of pixels, then it is considered to be noise-dominated and hence unusable.
| Quadrant | # 1 sec bins | Bins with >0 counts | Bins with >2000 counts | High rate bins dominated by noise | Noise dominated (total time) | Noise dominated (detector-on time) | Marked lightcurve |
|---|---|---|---|---|---|---|---|
| A | 22393 | 20009 | 0 | 0 | 0.00% | 0.00% |  |
| B | 22393 | 20009 | 23 | 23 | 0.10% | 0.11% | 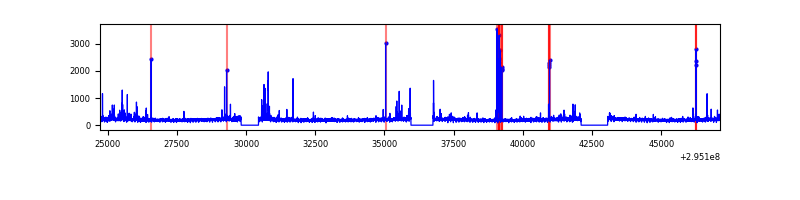 |
| C | 22393 | 20008 | 0 | 0 | 0.00% | 0.00% |  |
| D | 22393 | 20008 | 10 | 10 | 0.04% | 0.05% |  |
Top three noisy pixels from each quadrant. If the there are fewer than three noisy pixels in the level2.evt file, extra rows are filled as -1
| Pixel properties | Quadrant properties | ||||||
|---|---|---|---|---|---|---|---|
| Quadrant | DetID | PixID | Counts | Sigma | Mean | Median | Sigma |
| A | 4 | 2 | 29956 | 131.22 | 1002 | 984 | 220.8 |
| A | 13 | 254 | 23916 | 103.87 | 1002 | 984 | 220.8 |
| A | 12 | 194 | 7347 | 28.82 | 1002 | 984 | 220.8 |
| B | 3 | 64 | 114881 | 584.73 | 1002 | 976 | 194.8 |
| B | 0 | 198 | 51511 | 259.42 | 1002 | 976 | 194.8 |
| B | 7 | 220 | 40559 | 203.2 | 1002 | 976 | 194.8 |
| C | 3 | 233 | 827197 | 3575.5 | 963 | 957 | 231.1 |
| C | 10 | 223 | 18641 | 76.53 | 963 | 957 | 231.1 |
| C | 0 | 207 | 18493 | 75.89 | 963 | 957 | 231.1 |
| D | 12 | 218 | 1086706 | 4625.68 | 984 | 947 | 234.7 |
| D | 12 | 233 | 147988 | 626.44 | 984 | 947 | 234.7 |
| D | 1 | 52 | 141107 | 597.13 | 984 | 947 | 234.7 |
Histogram calculated using DETX and DETY for each event in the final _common_clean file
| Quadrant A |  |
 |
Quadrant B |
|---|---|---|---|
| Quadrant D | 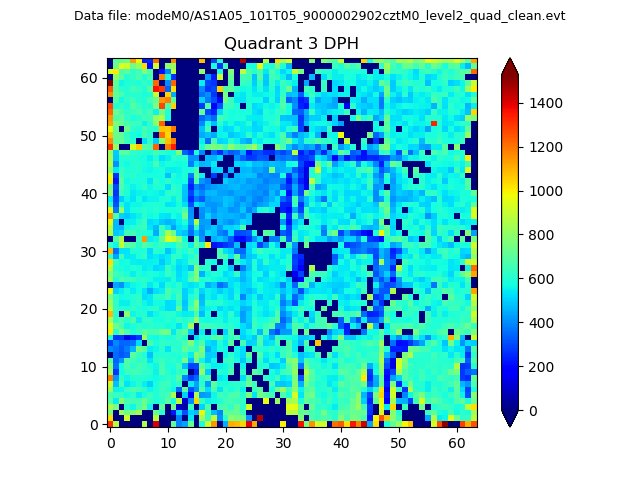 |
 |
Quadrant C |
| Plot type | Count rate plots | Images |
|---|---|---|
| Comparison with Poisson distribution Blue bars denote a histogram of data divided into 1 sec bins. Red curve is a Poisson curve with rate = median count rate of data. |
 |
 |
| Quadrant-wise count rates Data is divided into 100 sec bins |
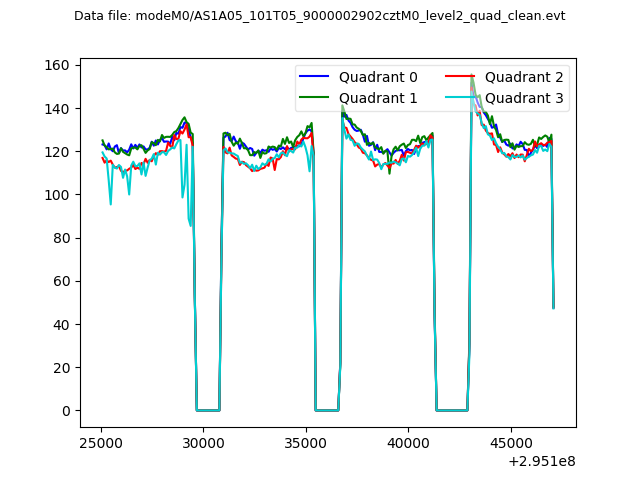 |
|
| Module-wise count rates for Quadrant A Data is divided into 100 sec bins |
 |
 |
| Module-wise count rates for Quadrant B Data is divided into 100 sec bins |
 |
 |
| Module-wise count rates for Quadrant C Data is divided into 100 sec bins |
 |
 |
| Module-wise count rates for Quadrant D Data is divided into 100 sec bins |
 |
 |
| Parameter | Plot |
|---|---|
| CZT HV Monitor | 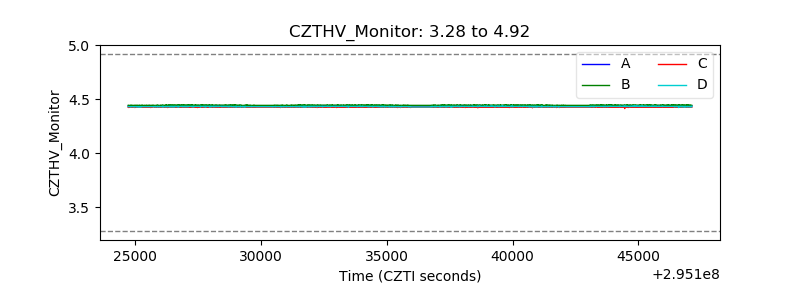 |
| D_VDD |  |
| Temperature 1 |  |
| Veto HV Monitor |  |
| Veto LLD |  |
| Alpha Counter |  |
| _CPM_Rate |  |
| CZT Counter |  |
| +2.5 Volts monitor |  |
| +5 Volts monitor |  |
| _ROLL_ROT | 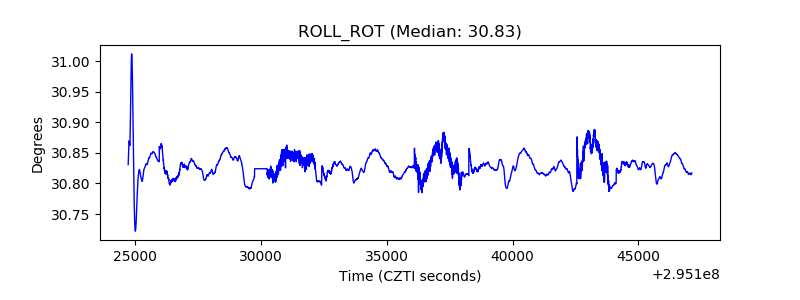 |
| _Roll_DEC |  |
| _Roll_RA |  |
| Veto Counter |  |