| Param | Original file | Final file |
|---|---|---|
| Filename | modeM0/AS1T03_112T01_9000002896cztM0_level2_bc.evt | modeM0/AS1T03_112T01_9000002896cztM0_level2_quad_clean.evt |
| Size (bytes) | 1,623,876,480 | 387,423,360 |
| Size | 1.5 GB | 369.5 MB |
| Events in quadrant A | 6,093,991 | 2,658,643 |
| Events in quadrant B | 6,629,474 | 2,697,715 |
| Events in quadrant C | 7,001,816 | 2,561,643 |
| Events in quadrant D | 27,428,889 | 1,776,427 |
| Mode SS | |||
|---|---|---|---|
| Quadrant | BADHDUFLAG | Total packets | Discarded packets |
| A | 0 | 606 | 0 |
| B | 0 | 606 | 0 |
| C | 0 | 606 | 0 |
| D | 0 | 606 | 0 |
| Mode M0 | |||
|---|---|---|---|
| Quadrant | BADHDUFLAG | Total packets | Discarded packets |
| A | 0 | 60568 | 0 |
| B | 0 | 62180 | 0 |
| C | 0 | 64340 | 0 |
| D | 0 | 157616 | 0 |
| Mode M9 | |||
|---|---|---|---|
| Quadrant | BADHDUFLAG | Total packets | Discarded packets |
| A | 0 | 55 | 0 |
| B | 0 | 55 | 0 |
| C | 0 | 55 | 0 |
| D | 0 | 55 | 0 |
| Quadrant | Total seconds | Saturated seconds | Saturation percentage |
|---|---|---|---|
| A | 29624 | 67 | 0.226168% |
| B | 29624 | 193 | 0.651499% |
| C | 29624 | 334 | 1.127464% |
| D | 29624 | 13069 | 44.116257% |
Noise dominated data is calculated using 1-second bins in cleaned event files. If a bin has >2000 counts, and if more than 50% of those come from <1% of pixels, then it is considered to be noise-dominated and hence unusable.
| Quadrant | # 1 sec bins | Bins with >0 counts | Bins with >2000 counts | High rate bins dominated by noise | Noise dominated (total time) | Noise dominated (detector-on time) | Marked lightcurve |
|---|---|---|---|---|---|---|---|
| A | 35159 | 29626 | 2 | 2 | 0.01% | 0.01% | 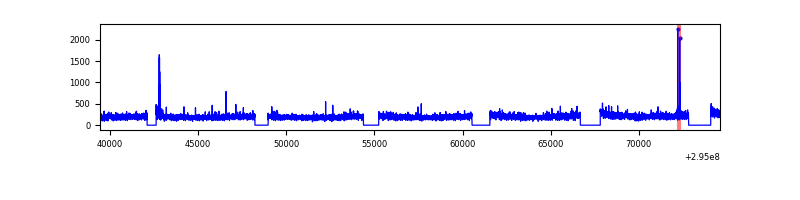 |
| B | 35159 | 29624 | 22 | 22 | 0.06% | 0.07% |  |
| C | 35159 | 29624 | 2 | 2 | 0.01% | 0.01% |  |
| D | 35159 | 29613 | 4164 | 4164 | 11.84% | 14.06% |  |
Top three noisy pixels from each quadrant. If the there are fewer than three noisy pixels in the level2.evt file, extra rows are filled as -1
| Pixel properties | Quadrant properties | ||||||
|---|---|---|---|---|---|---|---|
| Quadrant | DetID | PixID | Counts | Sigma | Mean | Median | Sigma |
| A | 13 | 254 | 38170 | 107.47 | 1564 | 1540 | 340.8 |
| A | 5 | 16 | 23764 | 65.21 | 1564 | 1540 | 340.8 |
| A | 4 | 2 | 21319 | 58.03 | 1564 | 1540 | 340.8 |
| B | 3 | 64 | 174464 | 581.25 | 1584 | 1548 | 297.5 |
| B | 7 | 220 | 106644 | 353.27 | 1584 | 1548 | 297.5 |
| B | 0 | 198 | 84177 | 277.75 | 1584 | 1548 | 297.5 |
| C | 3 | 233 | 1003817 | 2798.83 | 1508 | 1498 | 358.1 |
| C | 9 | 221 | 146782 | 405.68 | 1508 | 1498 | 358.1 |
| C | 7 | 247 | 29897 | 79.3 | 1508 | 1498 | 358.1 |
| D | 7 | 238 | 21123833 | 79952.45 | 1113 | 1076 | 264.2 |
| D | 13 | 104 | 951605 | 3597.88 | 1113 | 1076 | 264.2 |
| D | 1 | 52 | 540685 | 2042.49 | 1113 | 1076 | 264.2 |
Histogram calculated using DETX and DETY for each event in the final _common_clean file
| Quadrant A |  |
 |
Quadrant B |
|---|---|---|---|
| Quadrant D | 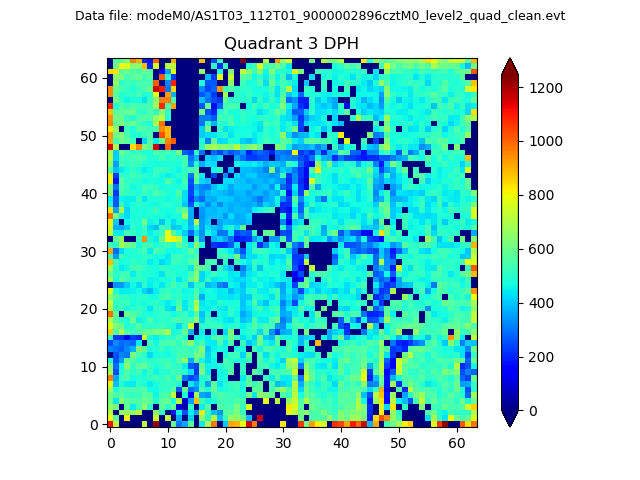 |
 |
Quadrant C |
| Plot type | Count rate plots | Images |
|---|---|---|
| Comparison with Poisson distribution Blue bars denote a histogram of data divided into 1 sec bins. Red curve is a Poisson curve with rate = median count rate of data. |
 |
 |
| Quadrant-wise count rates Data is divided into 100 sec bins |
 |
|
| Module-wise count rates for Quadrant A Data is divided into 100 sec bins |
 |
 |
| Module-wise count rates for Quadrant B Data is divided into 100 sec bins |
 |
 |
| Module-wise count rates for Quadrant C Data is divided into 100 sec bins |
 |
 |
| Module-wise count rates for Quadrant D Data is divided into 100 sec bins |
 |
 |
| Parameter | Plot |
|---|---|
| CZT HV Monitor | 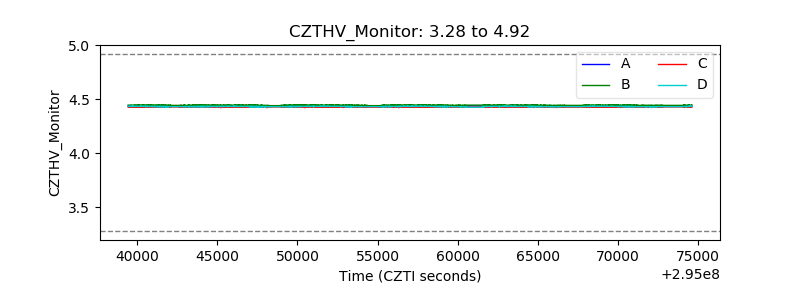 |
| D_VDD |  |
| Temperature 1 |  |
| Veto HV Monitor |  |
| Veto LLD |  |
| Alpha Counter |  |
| _CPM_Rate |  |
| CZT Counter |  |
| +2.5 Volts monitor | 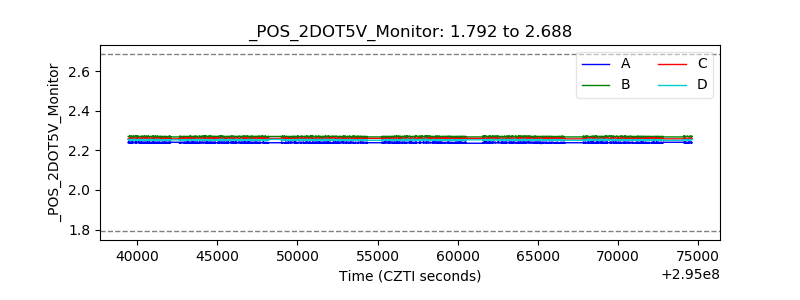 |
| +5 Volts monitor |  |
| _ROLL_ROT |  |
| _Roll_DEC |  |
| _Roll_RA |  |
| Veto Counter |  |