| Param | Original file | Final file |
|---|---|---|
| Filename | modeM0/AS1A05_175T01_9000002894cztM0_level2_bc.evt | modeM0/AS1A05_175T01_9000002894cztM0_level2_quad_clean.evt |
| Size (bytes) | 3,995,496,000 | 1,215,855,360 |
| Size | 3.7 GB | 1.1 GB |
| Events in quadrant A | 19,687,039 | 7,968,836 |
| Events in quadrant B | 21,096,985 | 8,002,221 |
| Events in quadrant C | 21,531,775 | 7,620,753 |
| Events in quadrant D | 52,205,372 | 6,708,120 |
| Mode M9 | |||
|---|---|---|---|
| Quadrant | BADHDUFLAG | Total packets | Discarded packets |
| A | 0 | 142 | 0 |
| B | 0 | 142 | 0 |
| C | 0 | 142 | 0 |
| D | 0 | 142 | 0 |
| Mode M0 | |||
|---|---|---|---|
| Quadrant | BADHDUFLAG | Total packets | Discarded packets |
| A | 0 | 196966 | 0 |
| B | 0 | 201214 | 0 |
| C | 0 | 203404 | 0 |
| D | 0 | 312079 | 0 |
| Mode SS | |||
|---|---|---|---|
| Quadrant | BADHDUFLAG | Total packets | Discarded packets |
| A | 0 | 1942 | 0 |
| B | 0 | 1942 | 0 |
| C | 0 | 1942 | 0 |
| D | 0 | 1942 | 0 |
| Quadrant | Total seconds | Saturated seconds | Saturation percentage |
|---|---|---|---|
| A | 95178 | 1189 | 1.249238% |
| B | 95178 | 1731 | 1.818698% |
| C | 95178 | 1980 | 2.080313% |
| D | 95178 | 13581 | 14.269054% |
Noise dominated data is calculated using 1-second bins in cleaned event files. If a bin has >2000 counts, and if more than 50% of those come from <1% of pixels, then it is considered to be noise-dominated and hence unusable.
| Quadrant | # 1 sec bins | Bins with >0 counts | Bins with >2000 counts | High rate bins dominated by noise | Noise dominated (total time) | Noise dominated (detector-on time) | Marked lightcurve |
|---|---|---|---|---|---|---|---|
| A | 109309 | 95175 | 2 | 2 | 0.00% | 0.00% |  |
| B | 109309 | 95176 | 135 | 135 | 0.12% | 0.14% |  |
| C | 109309 | 95176 | 40 | 40 | 0.04% | 0.04% | 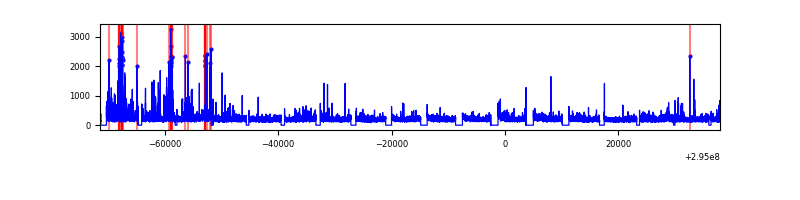 |
| D | 109308 | 95172 | 5683 | 5683 | 5.20% | 5.97% |  |
Top three noisy pixels from each quadrant. If the there are fewer than three noisy pixels in the level2.evt file, extra rows are filled as -1
| Pixel properties | Quadrant properties | ||||||
|---|---|---|---|---|---|---|---|
| Quadrant | DetID | PixID | Counts | Sigma | Mean | Median | Sigma |
| A | 13 | 254 | 90711 | 77.79 | 5072 | 4979 | 1102.1 |
| A | 11 | 47 | 82632 | 70.46 | 5072 | 4979 | 1102.1 |
| A | 4 | 2 | 51083 | 41.83 | 5072 | 4979 | 1102.1 |
| B | 3 | 64 | 822178 | 857.12 | 5079 | 4951 | 953.5 |
| B | 0 | 198 | 262264 | 269.87 | 5079 | 4951 | 953.5 |
| B | 4 | 171 | 127181 | 128.2 | 5079 | 4951 | 953.5 |
| C | 3 | 233 | 1519016 | 1341.95 | 4836 | 4810 | 1128.4 |
| C | 9 | 221 | 512674 | 450.09 | 4836 | 4810 | 1128.4 |
| C | 5 | 112 | 504360 | 442.72 | 4836 | 4810 | 1128.4 |
| D | 7 | 238 | 24598768 | 22987.49 | 4639 | 4475 | 1069.9 |
| D | 1 | 52 | 4751422 | 4436.82 | 4639 | 4475 | 1069.9 |
| D | 12 | 218 | 3257966 | 3040.93 | 4639 | 4475 | 1069.9 |
Histogram calculated using DETX and DETY for each event in the final _common_clean file
| Quadrant A | 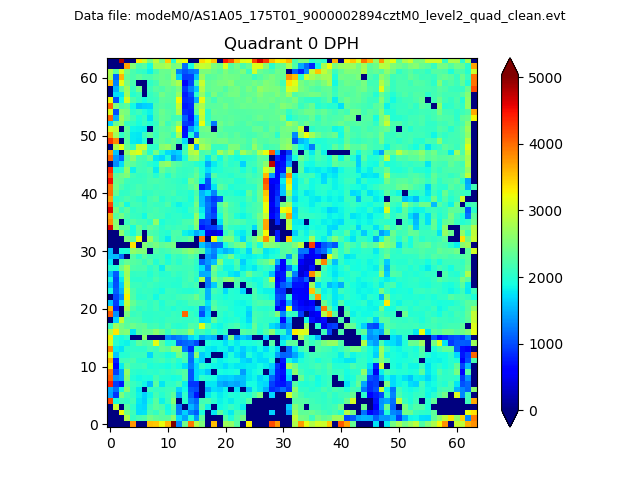 |
 |
Quadrant B |
|---|---|---|---|
| Quadrant D | 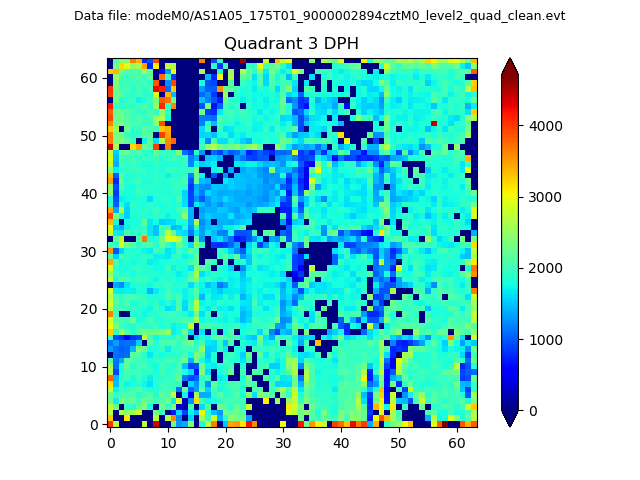 |
 |
Quadrant C |
| Plot type | Count rate plots | Images |
|---|---|---|
| Comparison with Poisson distribution Blue bars denote a histogram of data divided into 1 sec bins. Red curve is a Poisson curve with rate = median count rate of data. |
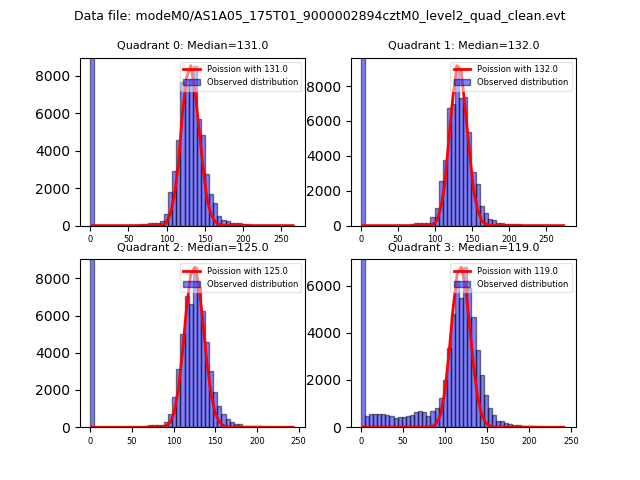 |
 |
| Quadrant-wise count rates Data is divided into 100 sec bins |
 |
|
| Module-wise count rates for Quadrant A Data is divided into 100 sec bins |
 |
 |
| Module-wise count rates for Quadrant B Data is divided into 100 sec bins |
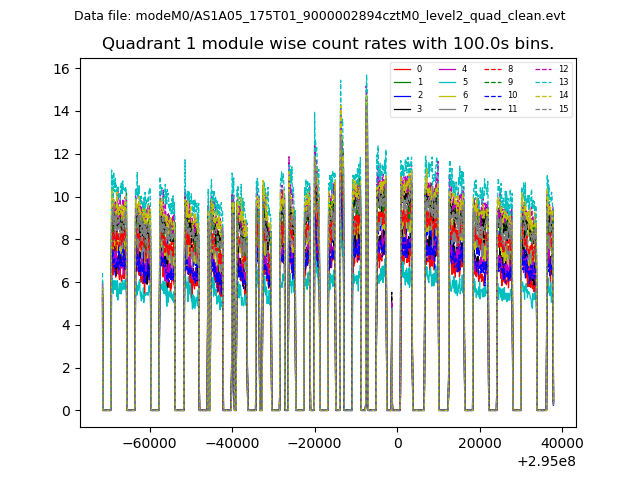 |
 |
| Module-wise count rates for Quadrant C Data is divided into 100 sec bins |
 |
 |
| Module-wise count rates for Quadrant D Data is divided into 100 sec bins |
 |
 |
| Parameter | Plot |
|---|---|
| CZT HV Monitor |  |
| D_VDD |  |
| Temperature 1 |  |
| Veto HV Monitor |  |
| Veto LLD |  |
| Alpha Counter |  |
| _CPM_Rate |  |
| CZT Counter |  |
| +2.5 Volts monitor |  |
| +5 Volts monitor |  |
| _ROLL_ROT | 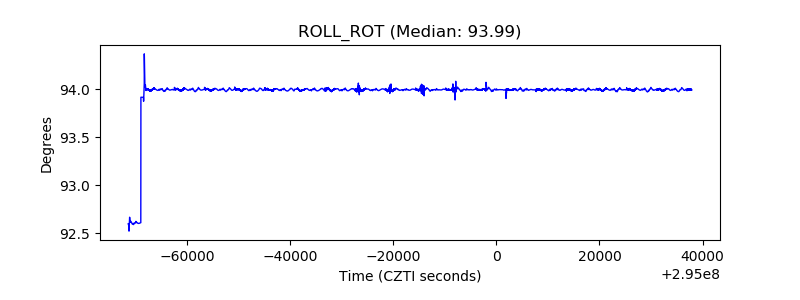 |
| _Roll_DEC |  |
| _Roll_RA | 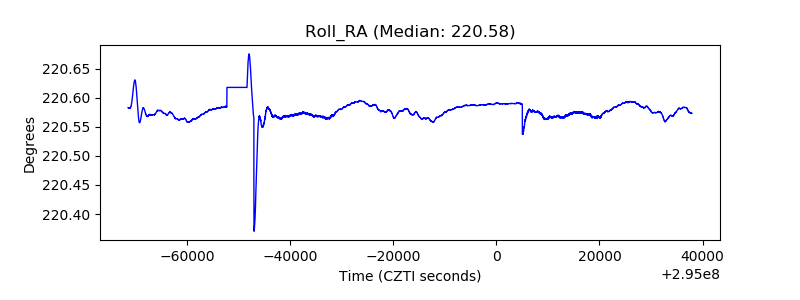 |
| Veto Counter |  |