| Param | Original file | Final file |
|---|---|---|
| Filename | modeM0/AS1A05_229T02_9000002890cztM0_level2_bc.evt | modeM0/AS1A05_229T02_9000002890cztM0_level2_quad_clean.evt |
| Size (bytes) | 7,363,503,360 | 2,264,330,880 |
| Size | 6.9 GB | 2.1 GB |
| Events in quadrant A | 39,598,816 | 14,483,715 |
| Events in quadrant B | 42,772,166 | 14,616,142 |
| Events in quadrant C | 46,265,297 | 14,078,563 |
| Events in quadrant D | 82,274,065 | 13,226,805 |
| Mode M0 | |||
|---|---|---|---|
| Quadrant | BADHDUFLAG | Total packets | Discarded packets |
| A | 0 | 375153 | 0 |
| B | 0 | 388718 | 0 |
| C | 0 | 406923 | 0 |
| D | 0 | 536463 | 0 |
| Mode SS | |||
|---|---|---|---|
| Quadrant | BADHDUFLAG | Total packets | Discarded packets |
| A | 0 | 3622 | 0 |
| B | 0 | 3622 | 0 |
| C | 0 | 3622 | 0 |
| D | 0 | 3622 | 0 |
| Mode M9 | |||
|---|---|---|---|
| Quadrant | BADHDUFLAG | Total packets | Discarded packets |
| A | 0 | 283 | 0 |
| B | 0 | 283 | 0 |
| C | 0 | 283 | 0 |
| D | 0 | 283 | 0 |
| Quadrant | Total seconds | Saturated seconds | Saturation percentage |
|---|---|---|---|
| A | 177793 | 2071 | 1.164838% |
| B | 177793 | 3338 | 1.877464% |
| C | 177793 | 3263 | 1.835280% |
| D | 177793 | 14564 | 8.191549% |
Noise dominated data is calculated using 1-second bins in cleaned event files. If a bin has >2000 counts, and if more than 50% of those come from <1% of pixels, then it is considered to be noise-dominated and hence unusable.
| Quadrant | # 1 sec bins | Bins with >0 counts | Bins with >2000 counts | High rate bins dominated by noise | Noise dominated (total time) | Noise dominated (detector-on time) | Marked lightcurve |
|---|---|---|---|---|---|---|---|
| A | 206004 | 177779 | 35 | 35 | 0.02% | 0.02% |  |
| B | 206004 | 177780 | 143 | 143 | 0.07% | 0.08% |  |
| C | 206004 | 177778 | 9 | 9 | 0.00% | 0.01% | 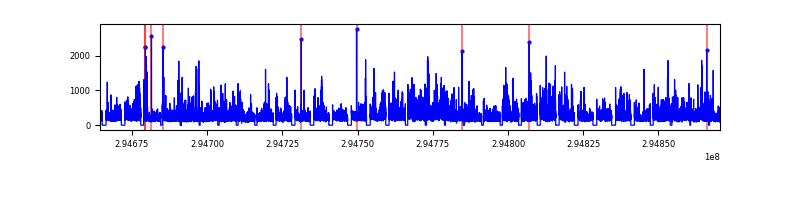 |
| D | 206004 | 177764 | 2744 | 2744 | 1.33% | 1.54% |  |
Top three noisy pixels from each quadrant. If the there are fewer than three noisy pixels in the level2.evt file, extra rows are filled as -1
| Pixel properties | Quadrant properties | ||||||
|---|---|---|---|---|---|---|---|
| Quadrant | DetID | PixID | Counts | Sigma | Mean | Median | Sigma |
| A | 5 | 16 | 795118 | 382.72 | 9639 | 9475 | 2052.8 |
| A | 4 | 2 | 724830 | 348.48 | 9639 | 9475 | 2052.8 |
| A | 11 | 29 | 422915 | 201.4 | 9639 | 9475 | 2052.8 |
| B | 3 | 112 | 1964855 | 1084.67 | 9656 | 9425 | 1802.8 |
| B | 7 | 220 | 900217 | 494.12 | 9656 | 9425 | 1802.8 |
| B | 3 | 64 | 630981 | 344.77 | 9656 | 9425 | 1802.8 |
| C | 9 | 221 | 5346483 | 2458.48 | 9280 | 9242 | 2170.9 |
| C | 3 | 233 | 4774399 | 2194.96 | 9280 | 9242 | 2170.9 |
| C | 0 | 207 | 223370 | 98.63 | 9280 | 9242 | 2170.9 |
| D | 1 | 52 | 18014808 | 8548.61 | 9157 | 8857 | 2106.3 |
| D | 7 | 238 | 12198759 | 5787.35 | 9157 | 8857 | 2106.3 |
| D | 5 | 222 | 6028086 | 2857.72 | 9157 | 8857 | 2106.3 |
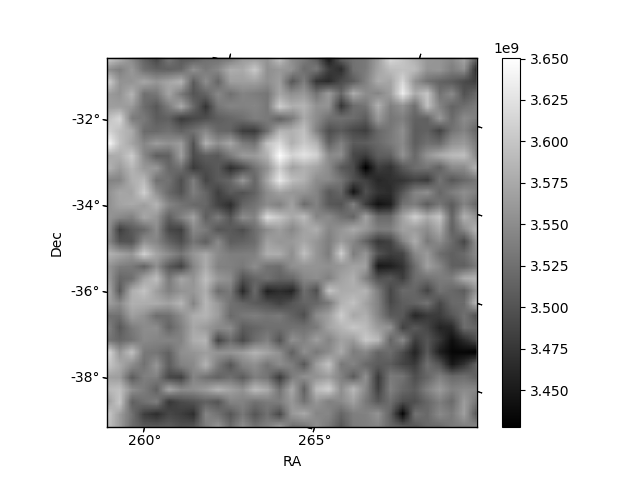
Histogram calculated using DETX and DETY for each event in the final _common_clean file
| Quadrant A |  |
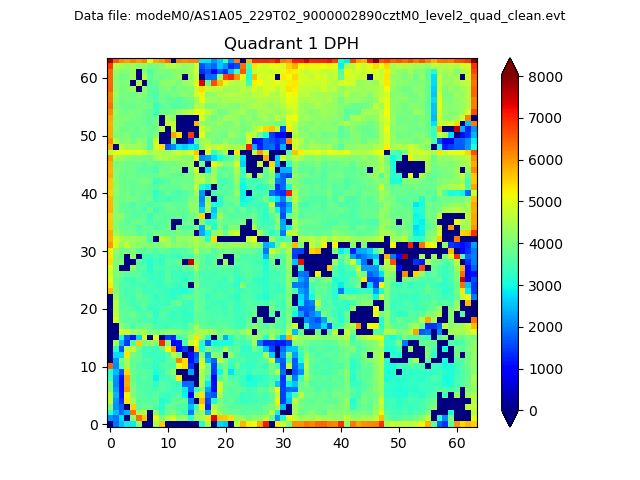 |
Quadrant B |
|---|---|---|---|
| Quadrant D |  |
 |
Quadrant C |
| Plot type | Count rate plots | Images |
|---|---|---|
| Comparison with Poisson distribution Blue bars denote a histogram of data divided into 1 sec bins. Red curve is a Poisson curve with rate = median count rate of data. |
 |
 |
| Quadrant-wise count rates Data is divided into 100 sec bins |
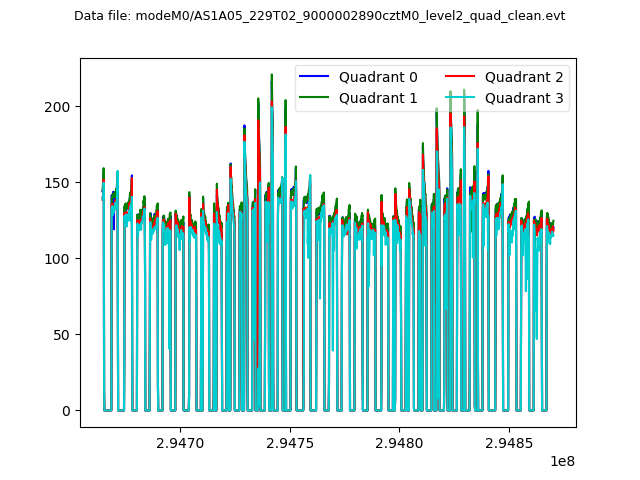 |
|
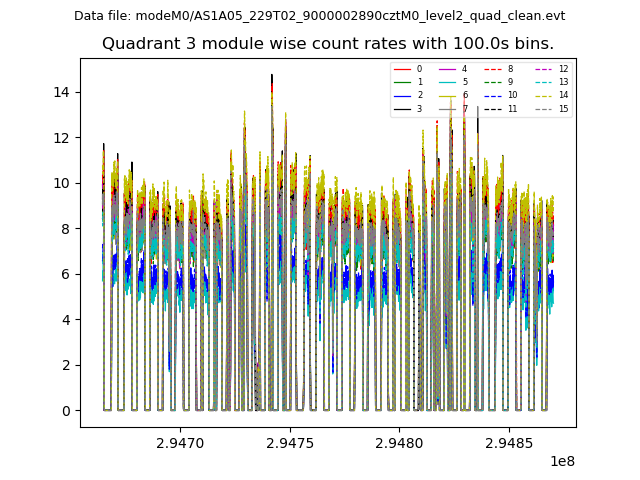
| Module-wise count rates for Quadrant A Data is divided into 100 sec bins |
 |
 |
| Module-wise count rates for Quadrant B Data is divided into 100 sec bins |
 |
 |
| Module-wise count rates for Quadrant C Data is divided into 100 sec bins |
 |
 |
| Module-wise count rates for Quadrant D Data is divided into 100 sec bins |
 |
 |
| Parameter | Plot |
|---|---|
| CZT HV Monitor |  |
| D_VDD |  |
| Temperature 1 |  |
| Veto HV Monitor |  |
| Veto LLD | 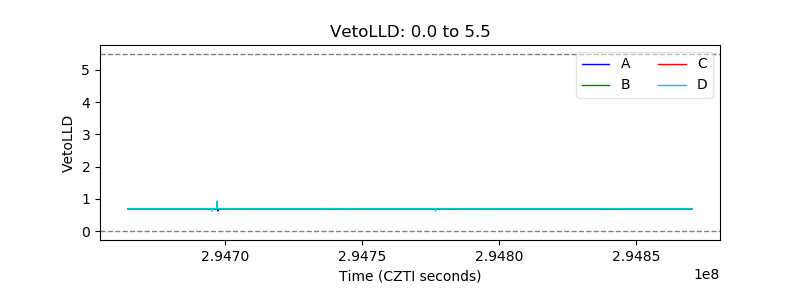 |
| Alpha Counter |  |
| _CPM_Rate |  |
| CZT Counter |  |
| +2.5 Volts monitor |  |
| +5 Volts monitor |  |
| _ROLL_ROT |  |
| _Roll_DEC |  |
| _Roll_RA | 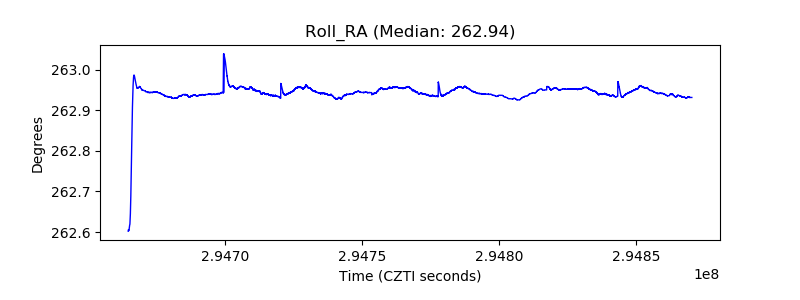 |
| Veto Counter |  |