| Param | Original file | Final file |
|---|---|---|
| Filename | modeM0/AS1A05_221T01_9000002888cztM0_level2_bc.evt | modeM0/AS1A05_221T01_9000002888cztM0_level2_quad_clean.evt |
| Size (bytes) | 5,751,815,040 | 1,803,009,600 |
| Size | 5.4 GB | 1.7 GB |
| Events in quadrant A | 31,936,038 | 11,401,083 |
| Events in quadrant B | 33,442,400 | 11,512,035 |
| Events in quadrant C | 31,104,663 | 11,153,732 |
| Events in quadrant D | 67,865,359 | 10,633,523 |
| Mode SS | |||
|---|---|---|---|
| Quadrant | BADHDUFLAG | Total packets | Discarded packets |
| A | 0 | 2942 | 0 |
| B | 0 | 2942 | 0 |
| C | 0 | 2942 | 0 |
| D | 0 | 2942 | 0 |
| Mode M9 | |||
|---|---|---|---|
| Quadrant | BADHDUFLAG | Total packets | Discarded packets |
| A | 0 | 225 | 0 |
| B | 0 | 226 | 0 |
| C | 0 | 226 | 0 |
| D | 0 | 226 | 0 |
| Mode M0 | |||
|---|---|---|---|
| Quadrant | BADHDUFLAG | Total packets | Discarded packets |
| A | 0 | 304260 | 0 |
| B | 0 | 311743 | 0 |
| C | 0 | 306378 | 0 |
| D | 0 | 441355 | 0 |
| Quadrant | Total seconds | Saturated seconds | Saturation percentage |
|---|---|---|---|
| A | 144672 | 1395 | 0.964250% |
| B | 144672 | 2012 | 1.390732% |
| C | 144672 | 2185 | 1.510313% |
| D | 144672 | 12188 | 8.424574% |
Noise dominated data is calculated using 1-second bins in cleaned event files. If a bin has >2000 counts, and if more than 50% of those come from <1% of pixels, then it is considered to be noise-dominated and hence unusable.
| Quadrant | # 1 sec bins | Bins with >0 counts | Bins with >2000 counts | High rate bins dominated by noise | Noise dominated (total time) | Noise dominated (detector-on time) | Marked lightcurve |
|---|---|---|---|---|---|---|---|
| A | 166811 | 144658 | 20 | 20 | 0.01% | 0.01% |  |
| B | 166811 | 144656 | 36 | 36 | 0.02% | 0.02% |  |
| C | 166811 | 144662 | 15 | 15 | 0.01% | 0.01% |  |
| D | 166811 | 144654 | 1094 | 1094 | 0.66% | 0.76% | 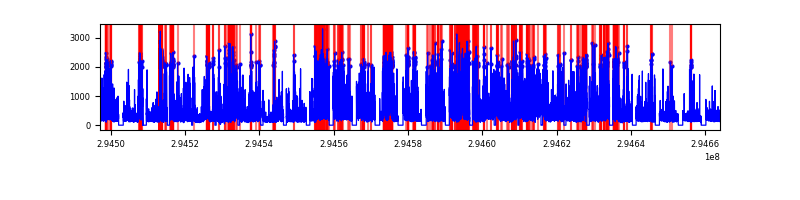 |
Top three noisy pixels from each quadrant. If the there are fewer than three noisy pixels in the level2.evt file, extra rows are filled as -1
| Pixel properties | Quadrant properties | ||||||
|---|---|---|---|---|---|---|---|
| Quadrant | DetID | PixID | Counts | Sigma | Mean | Median | Sigma |
| A | 3 | 1 | 538763 | 314.61 | 7884 | 7758 | 1687.8 |
| A | 5 | 16 | 335723 | 194.31 | 7884 | 7758 | 1687.8 |
| A | 11 | 29 | 320544 | 185.32 | 7884 | 7758 | 1687.8 |
| B | 7 | 220 | 814134 | 548.84 | 7898 | 7720 | 1469.3 |
| B | 0 | 198 | 543624 | 364.73 | 7898 | 7720 | 1469.3 |
| B | 0 | 197 | 428061 | 286.08 | 7898 | 7720 | 1469.3 |
| C | 9 | 221 | 1256574 | 704.2 | 7582 | 7555 | 1773.7 |
| C | 0 | 207 | 434602 | 240.77 | 7582 | 7555 | 1773.7 |
| C | 3 | 233 | 264807 | 145.04 | 7582 | 7555 | 1773.7 |
| D | 7 | 238 | 30293175 | 17449.43 | 7542 | 7288 | 1735.6 |
| D | 1 | 52 | 4448980 | 2559.11 | 7542 | 7288 | 1735.6 |
| D | 12 | 218 | 2301729 | 1321.96 | 7542 | 7288 | 1735.6 |
Histogram calculated using DETX and DETY for each event in the final _common_clean file
| Quadrant A | 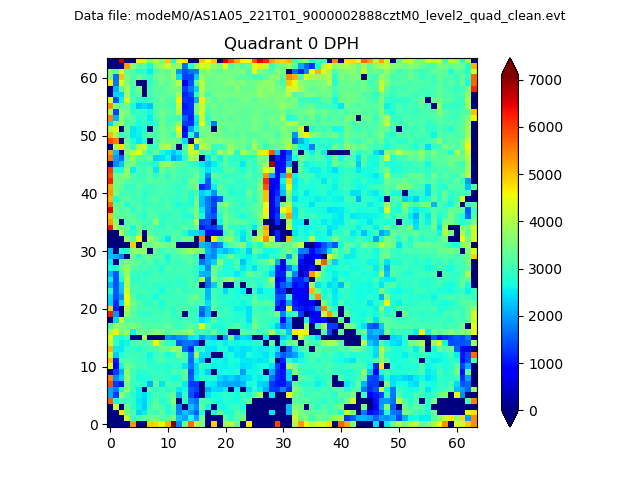 |
 |
Quadrant B |
|---|---|---|---|
| Quadrant D |  |
 |
Quadrant C |
| Plot type | Count rate plots | Images |
|---|---|---|
| Comparison with Poisson distribution Blue bars denote a histogram of data divided into 1 sec bins. Red curve is a Poisson curve with rate = median count rate of data. |
 |
 |
| Quadrant-wise count rates Data is divided into 100 sec bins |
 |
|
| Module-wise count rates for Quadrant A Data is divided into 100 sec bins |
 |
 |
| Module-wise count rates for Quadrant B Data is divided into 100 sec bins |
 |
 |
| Module-wise count rates for Quadrant C Data is divided into 100 sec bins |
 |
 |
| Module-wise count rates for Quadrant D Data is divided into 100 sec bins |
 |
 |
| Parameter | Plot |
|---|---|
| CZT HV Monitor |  |
| D_VDD |  |
| Temperature 1 |  |
| Veto HV Monitor |  |
| Veto LLD |  |
| Alpha Counter |  |
| _CPM_Rate |  |
| CZT Counter |  |
| +2.5 Volts monitor |  |
| +5 Volts monitor |  |
| _ROLL_ROT |  |
| _Roll_DEC |  |
| _Roll_RA |  |
| Veto Counter | 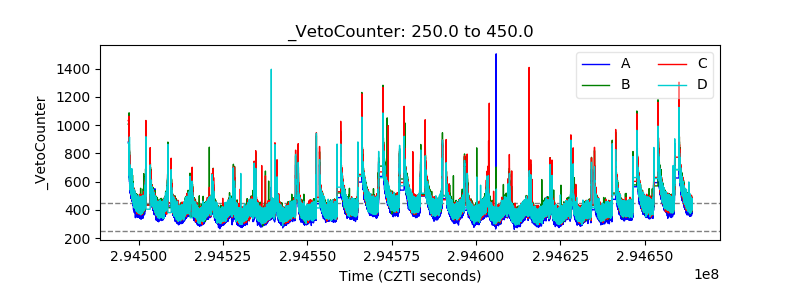 |