| Param | Original file | Final file |
|---|---|---|
| Filename | modeM0/AS1A05_212T09_9000002886cztM0_level2_bc.evt | modeM0/AS1A05_212T09_9000002886cztM0_level2_quad_clean.evt |
| Size (bytes) | 545,042,880 | 202,129,920 |
| Size | 519.8 MB | 192.8 MB |
| Events in quadrant A | 3,524,775 | 1,318,153 |
| Events in quadrant B | 3,626,045 | 1,319,270 |
| Events in quadrant C | 3,241,920 | 1,247,273 |
| Events in quadrant D | 5,126,630 | 1,243,222 |
| Mode SS | |||
|---|---|---|---|
| Quadrant | BADHDUFLAG | Total packets | Discarded packets |
| A | 0 | 294 | 0 |
| B | 0 | 294 | 0 |
| C | 0 | 294 | 0 |
| D | 0 | 294 | 0 |
| Mode M0 | |||
|---|---|---|---|
| Quadrant | BADHDUFLAG | Total packets | Discarded packets |
| A | 0 | 31019 | 0 |
| B | 0 | 31486 | 0 |
| C | 0 | 30629 | 0 |
| D | 0 | 36067 | 0 |
| Mode M9 | |||
|---|---|---|---|
| Quadrant | BADHDUFLAG | Total packets | Discarded packets |
| A | 0 | 32 | 0 |
| B | 0 | 32 | 0 |
| C | 0 | 32 | 0 |
| D | 0 | 32 | 0 |
| Quadrant | Total seconds | Saturated seconds | Saturation percentage |
|---|---|---|---|
| A | 14394 | 140 | 0.972627% |
| B | 14394 | 182 | 1.264416% |
| C | 14394 | 194 | 1.347784% |
| D | 14394 | 337 | 2.341253% |
Noise dominated data is calculated using 1-second bins in cleaned event files. If a bin has >2000 counts, and if more than 50% of those come from <1% of pixels, then it is considered to be noise-dominated and hence unusable.
| Quadrant | # 1 sec bins | Bins with >0 counts | Bins with >2000 counts | High rate bins dominated by noise | Noise dominated (total time) | Noise dominated (detector-on time) | Marked lightcurve |
|---|---|---|---|---|---|---|---|
| A | 16913 | 14391 | 0 | 0 | 0.00% | 0.00% |  |
| B | 16913 | 14391 | 4 | 4 | 0.02% | 0.03% |  |
| C | 16913 | 14391 | 0 | 0 | 0.00% | 0.00% |  |
| D | 16913 | 14391 | 87 | 87 | 0.51% | 0.60% |  |
Top three noisy pixels from each quadrant. If the there are fewer than three noisy pixels in the level2.evt file, extra rows are filled as -1
| Pixel properties | Quadrant properties | ||||||
|---|---|---|---|---|---|---|---|
| Quadrant | DetID | PixID | Counts | Sigma | Mean | Median | Sigma |
| A | 5 | 16 | 128533 | 685.46 | 872 | 860 | 186.3 |
| A | 13 | 254 | 20801 | 107.06 | 872 | 860 | 186.3 |
| A | 12 | 96 | 15698 | 79.66 | 872 | 860 | 186.3 |
| B | 7 | 220 | 124754 | 781.12 | 860 | 843 | 158.6 |
| B | 0 | 198 | 53694 | 333.17 | 860 | 843 | 158.6 |
| B | 3 | 64 | 37607 | 231.76 | 860 | 843 | 158.6 |
| C | 3 | 233 | 88917 | 461.59 | 817 | 815 | 190.9 |
| C | 9 | 221 | 7530 | 35.18 | 817 | 815 | 190.9 |
| C | 13 | 61 | 4730 | 20.51 | 817 | 815 | 190.9 |
| D | 1 | 52 | 1483062 | 7640.66 | 855 | 829 | 194.0 |
| D | 7 | 238 | 230109 | 1181.9 | 855 | 829 | 194.0 |
| D | 7 | 96 | 57140 | 290.27 | 855 | 829 | 194.0 |
Histogram calculated using DETX and DETY for each event in the final _common_clean file
| Quadrant A |  |
 |
Quadrant B |
|---|---|---|---|
| Quadrant D |  |
 |
Quadrant C |
| Plot type | Count rate plots | Images |
|---|---|---|
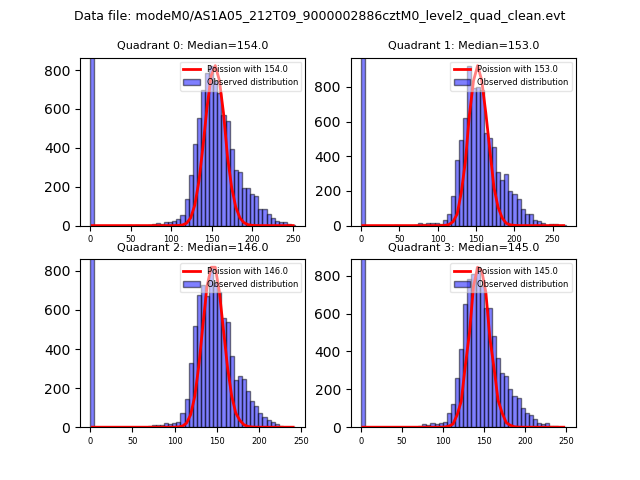
| Comparison with Poisson distribution Blue bars denote a histogram of data divided into 1 sec bins. Red curve is a Poisson curve with rate = median count rate of data. |
 |
 |
| Quadrant-wise count rates Data is divided into 100 sec bins |
 |
|
| Module-wise count rates for Quadrant A Data is divided into 100 sec bins |
 |
 |
| Module-wise count rates for Quadrant B Data is divided into 100 sec bins |
 |
 |
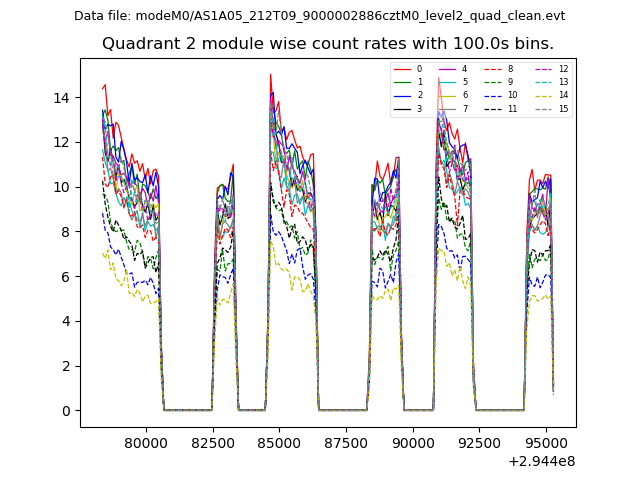
| Module-wise count rates for Quadrant C Data is divided into 100 sec bins |
 |
 |
| Module-wise count rates for Quadrant D Data is divided into 100 sec bins |
 |
 |
| Parameter | Plot |
|---|---|
| CZT HV Monitor |  |
| D_VDD | 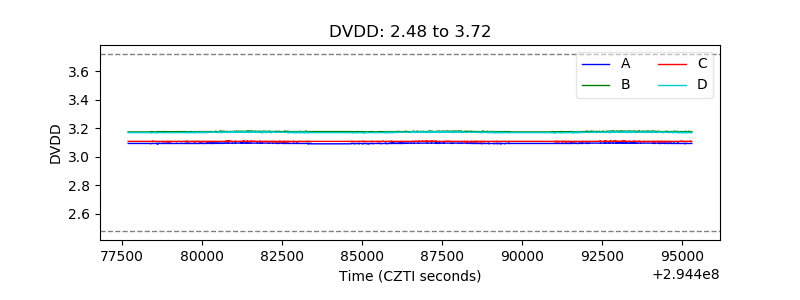 |
| Temperature 1 |  |
| Veto HV Monitor |  |
| Veto LLD |  |
| Alpha Counter |  |
| _CPM_Rate |  |
| CZT Counter | 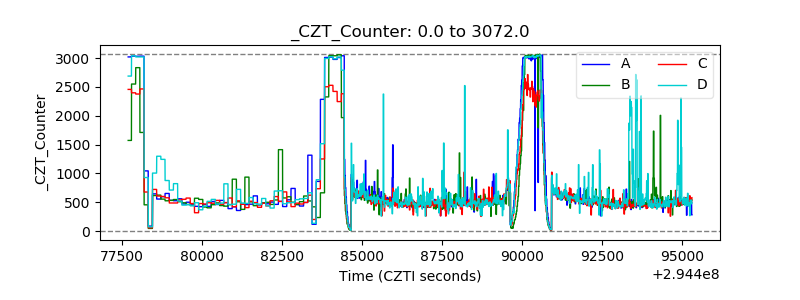 |
| +2.5 Volts monitor |  |
| +5 Volts monitor |  |
| _ROLL_ROT | 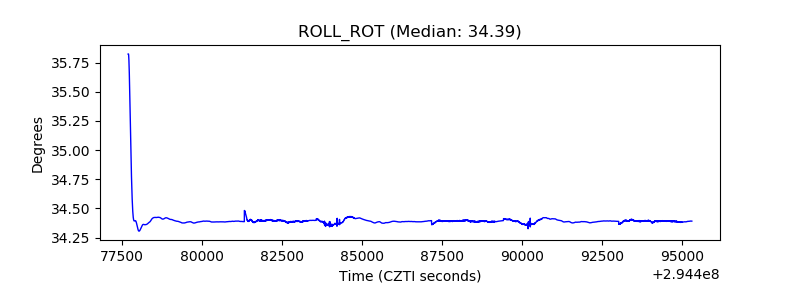 |
| _Roll_DEC |  |
| _Roll_RA |  |
| Veto Counter |  |