| Param | Original file | Final file |
|---|---|---|
| Filename | modeM0/AS1A06_009T02_9000002882cztM0_level2_bc.evt | modeM0/AS1A06_009T02_9000002882cztM0_level2_quad_clean.evt |
| Size (bytes) | 364,083,840 | 115,240,320 |
| Size | 347.2 MB | 109.9 MB |
| Events in quadrant A | 1,796,077 | 741,114 |
| Events in quadrant B | 2,153,123 | 750,937 |
| Events in quadrant C | 1,877,275 | 716,646 |
| Events in quadrant D | 4,608,809 | 686,398 |
| Mode M9 | |||
|---|---|---|---|
| Quadrant | BADHDUFLAG | Total packets | Discarded packets |
| A | 0 | 12 | 0 |
| B | 0 | 12 | 0 |
| C | 0 | 12 | 0 |
| D | 0 | 12 | 0 |
| Mode M0 | |||
|---|---|---|---|
| Quadrant | BADHDUFLAG | Total packets | Discarded packets |
| A | 0 | 17871 | 0 |
| B | 0 | 19030 | 0 |
| C | 0 | 18306 | 0 |
| D | 0 | 26916 | 0 |
| Mode SS | |||
|---|---|---|---|
| Quadrant | BADHDUFLAG | Total packets | Discarded packets |
| A | 0 | 176 | 0 |
| B | 0 | 176 | 0 |
| C | 0 | 176 | 0 |
| D | 0 | 176 | 0 |
| Quadrant | Total seconds | Saturated seconds | Saturation percentage |
|---|---|---|---|
| A | 8568 | 103 | 1.202148% |
| B | 8568 | 208 | 2.427638% |
| C | 8568 | 171 | 1.995798% |
| D | 8568 | 619 | 7.224556% |
Noise dominated data is calculated using 1-second bins in cleaned event files. If a bin has >2000 counts, and if more than 50% of those come from <1% of pixels, then it is considered to be noise-dominated and hence unusable.
| Quadrant | # 1 sec bins | Bins with >0 counts | Bins with >2000 counts | High rate bins dominated by noise | Noise dominated (total time) | Noise dominated (detector-on time) | Marked lightcurve |
|---|---|---|---|---|---|---|---|
| A | 9773 | 8566 | 0 | 0 | 0.00% | 0.00% | 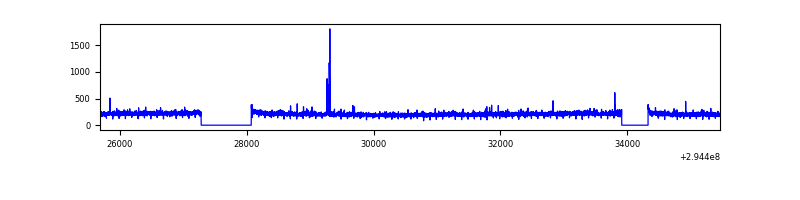 |
| B | 9773 | 8566 | 1 | 1 | 0.01% | 0.01% |  |
| C | 9773 | 8567 | 0 | 0 | 0.00% | 0.00% | 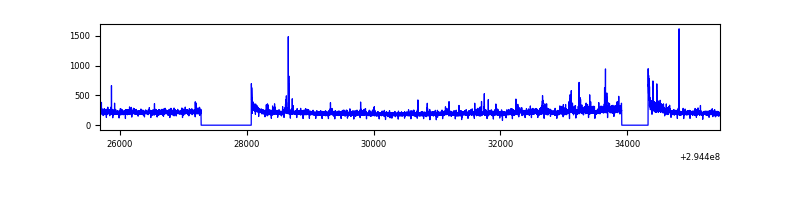 |
| D | 9773 | 8568 | 144 | 144 | 1.47% | 1.68% | 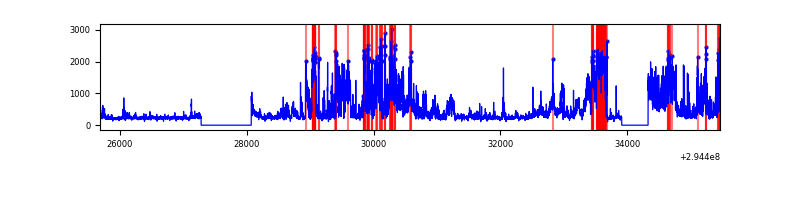 |
Top three noisy pixels from each quadrant. If the there are fewer than three noisy pixels in the level2.evt file, extra rows are filled as -1
| Pixel properties | Quadrant properties | ||||||
|---|---|---|---|---|---|---|---|
| Quadrant | DetID | PixID | Counts | Sigma | Mean | Median | Sigma |
| A | 15 | 174 | 18023 | 172.05 | 457 | 447 | 102.2 |
| A | 13 | 254 | 12643 | 119.39 | 457 | 447 | 102.2 |
| A | 11 | 29 | 8805 | 81.82 | 457 | 447 | 102.2 |
| B | 4 | 174 | 236321 | 2582.35 | 461 | 449 | 91.3 |
| B | 7 | 220 | 70384 | 765.66 | 461 | 449 | 91.3 |
| B | 0 | 190 | 18696 | 199.77 | 461 | 449 | 91.3 |
| C | 3 | 233 | 151724 | 1431.28 | 440 | 439 | 105.7 |
| C | 0 | 207 | 11652 | 106.08 | 440 | 439 | 105.7 |
| C | 4 | 175 | 9014 | 81.13 | 440 | 439 | 105.7 |
| D | 7 | 238 | 2863432 | 27788.62 | 439 | 423 | 103.0 |
| D | 2 | 234 | 34512 | 330.87 | 439 | 423 | 103.0 |
| D | 8 | 195 | 22819 | 217.38 | 439 | 423 | 103.0 |
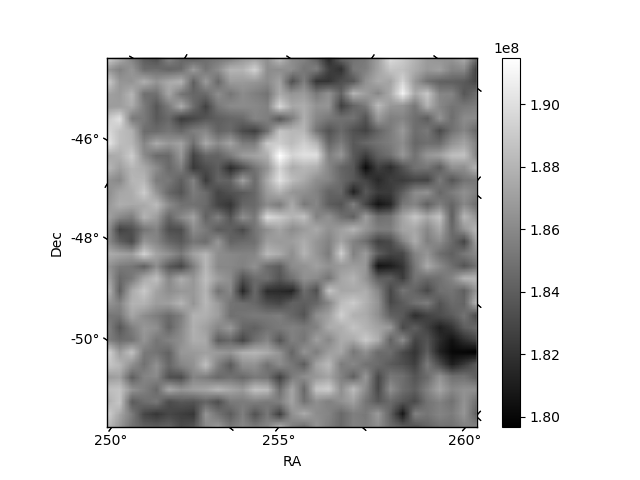
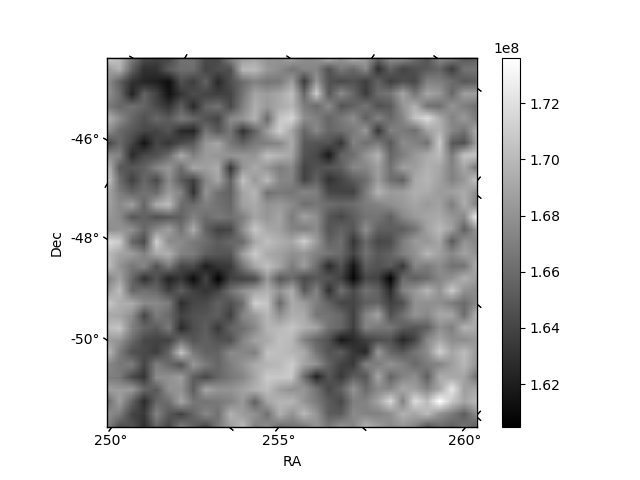
Histogram calculated using DETX and DETY for each event in the final _common_clean file
| Quadrant A |  |
 |
Quadrant B |
|---|---|---|---|
| Quadrant D |  |
 |
Quadrant C |
| Plot type | Count rate plots | Images |
|---|---|---|
| Comparison with Poisson distribution Blue bars denote a histogram of data divided into 1 sec bins. Red curve is a Poisson curve with rate = median count rate of data. |
 |
 |
| Quadrant-wise count rates Data is divided into 100 sec bins |
 |
|
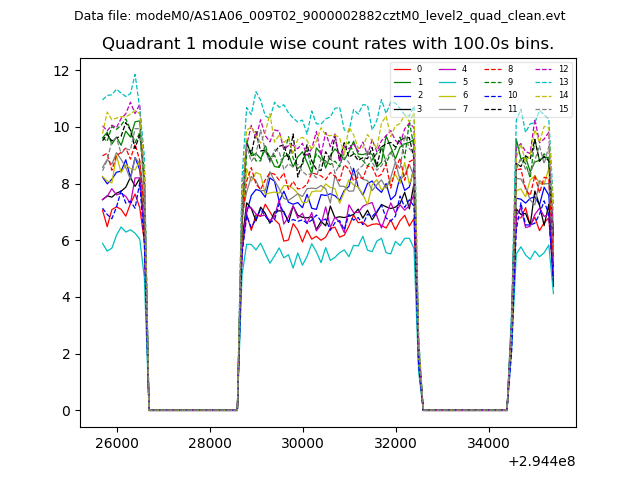
| Module-wise count rates for Quadrant A Data is divided into 100 sec bins |
 |
 |
| Module-wise count rates for Quadrant B Data is divided into 100 sec bins |
 |
 |
| Module-wise count rates for Quadrant C Data is divided into 100 sec bins |
 |
 |
| Module-wise count rates for Quadrant D Data is divided into 100 sec bins |
 |
 |
| Parameter | Plot |
|---|---|
| CZT HV Monitor |  |
| D_VDD |  |
| Temperature 1 |  |
| Veto HV Monitor |  |
| Veto LLD |  |
| Alpha Counter | 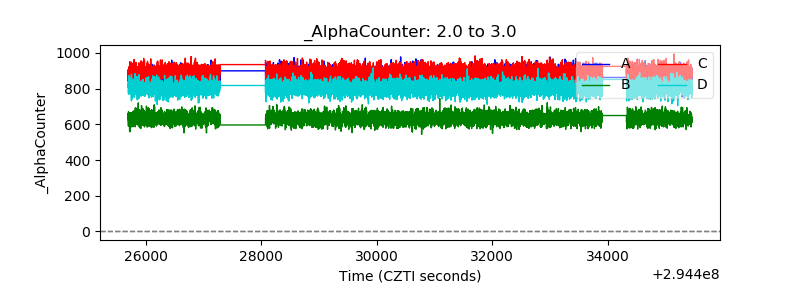 |
| _CPM_Rate | 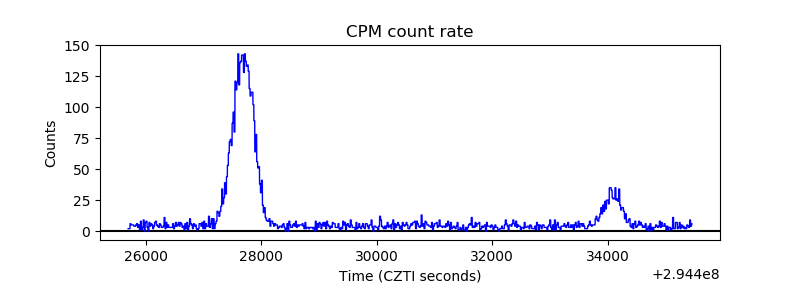 |
| CZT Counter |  |
| +2.5 Volts monitor |  |
| +5 Volts monitor | 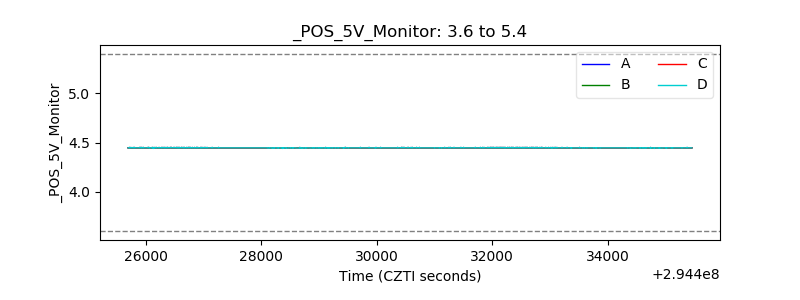 |
| _ROLL_ROT |  |
| _Roll_DEC | 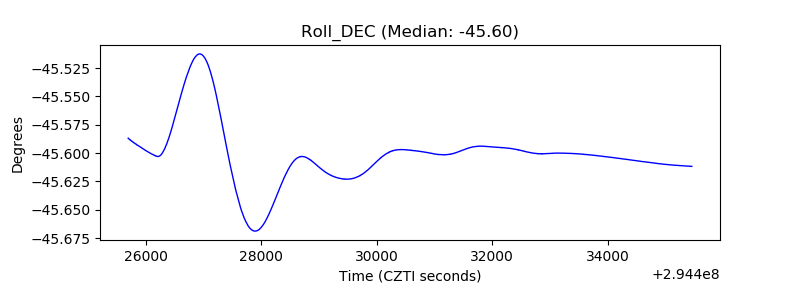 |
| _Roll_RA | 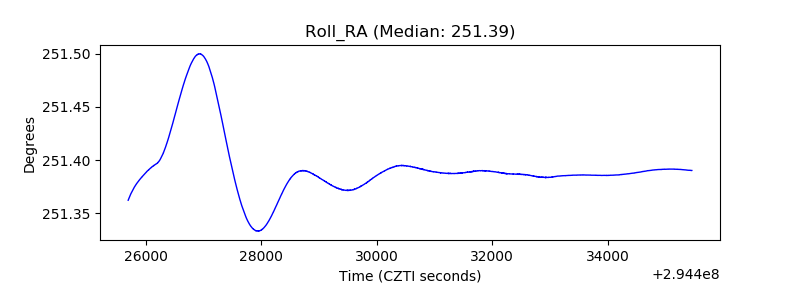 |
| Veto Counter |  |