| Param | Original file | Final file |
|---|---|---|
| Filename | modeM0/AS1A05_226T09_9000002884cztM0_level2_bc.evt | modeM0/AS1A05_226T09_9000002884cztM0_level2_quad_clean.evt |
| Size (bytes) | 1,539,198,720 | 412,159,680 |
| Size | 1.4 GB | 393.1 MB |
| Events in quadrant A | 7,441,582 | 2,682,601 |
| Events in quadrant B | 8,012,733 | 2,678,616 |
| Events in quadrant C | 7,264,665 | 2,538,946 |
| Events in quadrant D | 21,438,128 | 2,108,709 |
| Mode M0 | |||
|---|---|---|---|
| Quadrant | BADHDUFLAG | Total packets | Discarded packets |
| A | 0 | 74115 | 0 |
| B | 0 | 76759 | 0 |
| C | 0 | 74240 | 0 |
| D | 0 | 132434 | 0 |
| Mode M9 | |||
|---|---|---|---|
| Quadrant | BADHDUFLAG | Total packets | Discarded packets |
| A | 0 | 39 | 0 |
| B | 0 | 39 | 0 |
| C | 0 | 39 | 0 |
| D | 0 | 39 | 0 |
| Mode SS | |||
|---|---|---|---|
| Quadrant | BADHDUFLAG | Total packets | Discarded packets |
| A | 0 | 730 | 0 |
| B | 0 | 730 | 0 |
| C | 0 | 730 | 0 |
| D | 0 | 730 | 0 |
| Quadrant | Total seconds | Saturated seconds | Saturation percentage |
|---|---|---|---|
| A | 36000 | 139 | 0.386111% |
| B | 36000 | 331 | 0.919444% |
| C | 36000 | 282 | 0.783333% |
| D | 36000 | 7206 | 20.016667% |
Noise dominated data is calculated using 1-second bins in cleaned event files. If a bin has >2000 counts, and if more than 50% of those come from <1% of pixels, then it is considered to be noise-dominated and hence unusable.
| Quadrant | # 1 sec bins | Bins with >0 counts | Bins with >2000 counts | High rate bins dominated by noise | Noise dominated (total time) | Noise dominated (detector-on time) | Marked lightcurve |
|---|---|---|---|---|---|---|---|
| A | 39850 | 35998 | 2 | 2 | 0.01% | 0.01% |  |
| B | 39850 | 35998 | 2 | 2 | 0.01% | 0.01% |  |
| C | 39850 | 35998 | 0 | 0 | 0.00% | 0.00% |  |
| D | 39850 | 35998 | 1423 | 1423 | 3.57% | 3.95% | 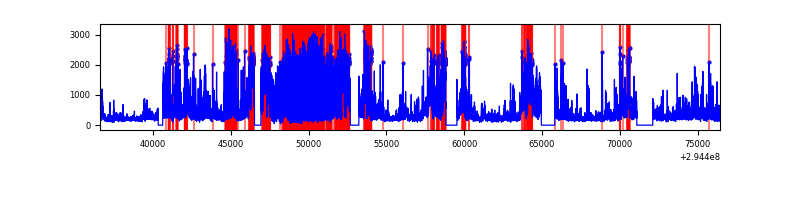 |
Top three noisy pixels from each quadrant. If the there are fewer than three noisy pixels in the level2.evt file, extra rows are filled as -1
| Pixel properties | Quadrant properties | ||||||
|---|---|---|---|---|---|---|---|
| Quadrant | DetID | PixID | Counts | Sigma | Mean | Median | Sigma |
| A | 9 | 143 | 160860 | 389.64 | 1861 | 1828 | 408.2 |
| A | 13 | 254 | 49778 | 117.48 | 1861 | 1828 | 408.2 |
| A | 12 | 96 | 42231 | 98.99 | 1861 | 1828 | 408.2 |
| B | 7 | 220 | 408999 | 1145.88 | 1861 | 1812 | 355.4 |
| B | 0 | 198 | 161366 | 449.0 | 1861 | 1812 | 355.4 |
| B | 0 | 230 | 102286 | 282.75 | 1861 | 1812 | 355.4 |
| C | 3 | 233 | 382129 | 925.56 | 1755 | 1741 | 411.0 |
| C | 9 | 221 | 62315 | 147.39 | 1755 | 1741 | 411.0 |
| C | 0 | 207 | 27930 | 63.72 | 1755 | 1741 | 411.0 |
| D | 7 | 238 | 8555551 | 23076.22 | 1602 | 1544 | 370.7 |
| D | 1 | 52 | 6356051 | 17142.61 | 1602 | 1544 | 370.7 |
| D | 12 | 218 | 178615 | 477.68 | 1602 | 1544 | 370.7 |
Histogram calculated using DETX and DETY for each event in the final _common_clean file
| Quadrant A |  |
 |
Quadrant B |
|---|---|---|---|
| Quadrant D |  |
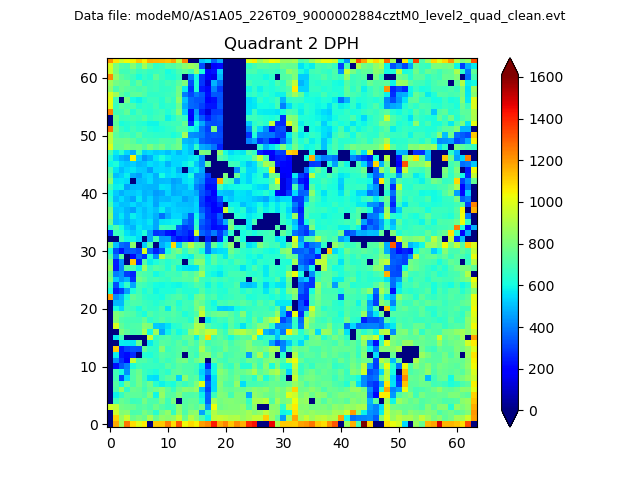 |
Quadrant C |
| Plot type | Count rate plots | Images |
|---|---|---|
| Comparison with Poisson distribution Blue bars denote a histogram of data divided into 1 sec bins. Red curve is a Poisson curve with rate = median count rate of data. |
 |
 |
| Quadrant-wise count rates Data is divided into 100 sec bins |
 |
|
| Module-wise count rates for Quadrant A Data is divided into 100 sec bins |
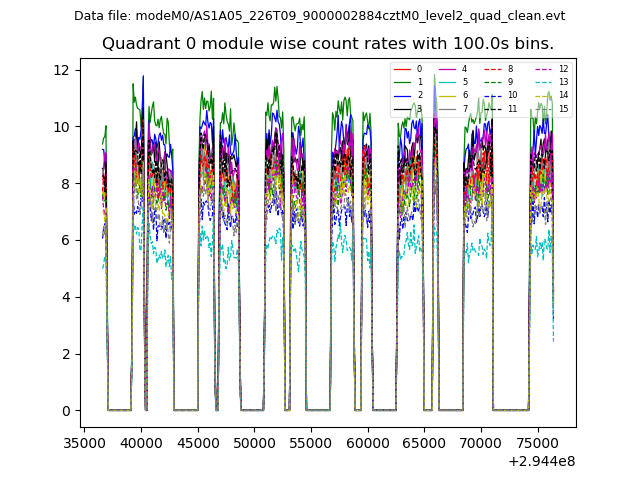 |
 |
| Module-wise count rates for Quadrant B Data is divided into 100 sec bins |
 |
 |
| Module-wise count rates for Quadrant C Data is divided into 100 sec bins |
 |
 |
| Module-wise count rates for Quadrant D Data is divided into 100 sec bins |
 |
 |
| Parameter | Plot |
|---|---|
| CZT HV Monitor |  |
| D_VDD |  |
| Temperature 1 |  |
| Veto HV Monitor |  |
| Veto LLD | 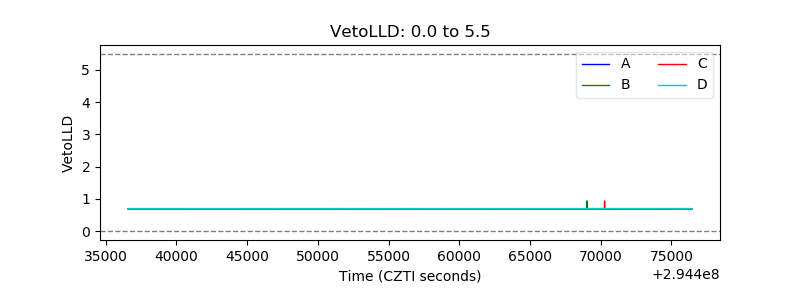 |
| Alpha Counter | 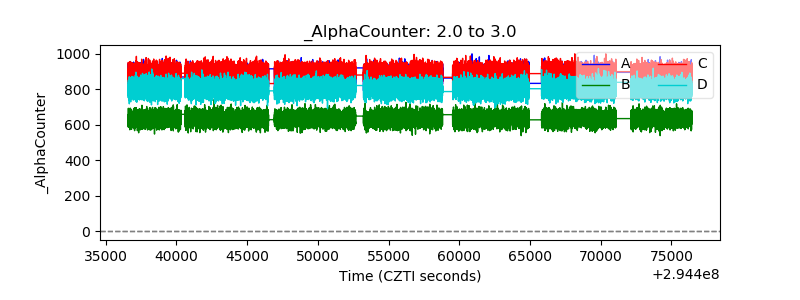 |
| _CPM_Rate | 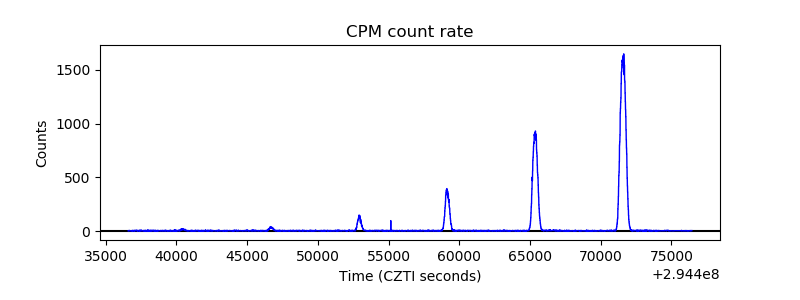 |
| CZT Counter |  |
| +2.5 Volts monitor | 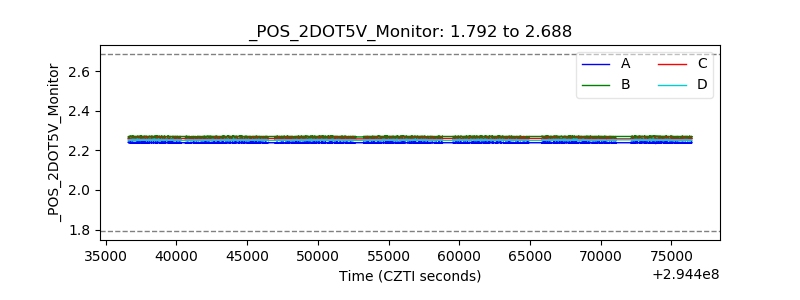 |
| +5 Volts monitor | 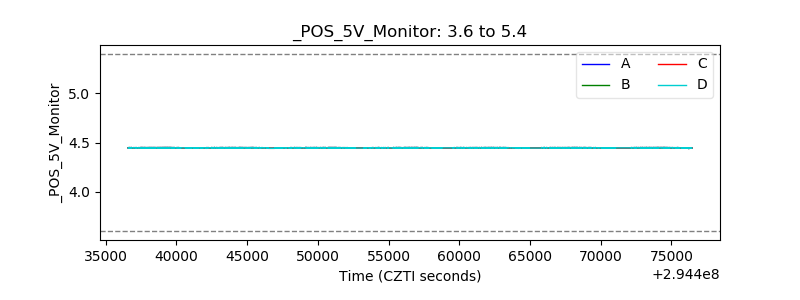 |
| _ROLL_ROT |  |
| _Roll_DEC |  |
| _Roll_RA |  |
| Veto Counter |  |