| Param | Original file | Final file |
|---|---|---|
| Filename | modeM0/AS1T03_105T01_9000002876cztM0_level2_bc.evt | modeM0/AS1T03_105T01_9000002876cztM0_level2_quad_clean.evt |
| Size (bytes) | 1,189,831,680 | 281,568,960 |
| Size | 1.1 GB | 268.5 MB |
| Events in quadrant A | 4,767,203 | 1,873,040 |
| Events in quadrant B | 4,788,185 | 1,884,830 |
| Events in quadrant C | 4,512,558 | 1,840,997 |
| Events in quadrant D | 20,445,549 | 1,400,464 |
| Mode M0 | |||
|---|---|---|---|
| Quadrant | BADHDUFLAG | Total packets | Discarded packets |
| A | 0 | 46654 | 0 |
| B | 0 | 46934 | 0 |
| C | 0 | 46357 | 0 |
| D | 0 | 136420 | 0 |
| Mode SS | |||
|---|---|---|---|
| Quadrant | BADHDUFLAG | Total packets | Discarded packets |
| A | 0 | 454 | 0 |
| B | 0 | 454 | 0 |
| C | 0 | 454 | 0 |
| D | 0 | 454 | 0 |
| Mode M9 | |||
|---|---|---|---|
| Quadrant | BADHDUFLAG | Total packets | Discarded packets |
| A | 0 | 16 | 0 |
| B | 0 | 16 | 0 |
| C | 0 | 16 | 0 |
| D | 0 | 16 | 0 |
| Quadrant | Total seconds | Saturated seconds | Saturation percentage |
|---|---|---|---|
| A | 22155 | 219 | 0.988490% |
| B | 22155 | 257 | 1.160009% |
| C | 22155 | 370 | 1.670052% |
| D | 22155 | 12888 | 58.171970% |
Noise dominated data is calculated using 1-second bins in cleaned event files. If a bin has >2000 counts, and if more than 50% of those come from <1% of pixels, then it is considered to be noise-dominated and hence unusable.
| Quadrant | # 1 sec bins | Bins with >0 counts | Bins with >2000 counts | High rate bins dominated by noise | Noise dominated (total time) | Noise dominated (detector-on time) | Marked lightcurve |
|---|---|---|---|---|---|---|---|
| A | 23856 | 22154 | 19 | 19 | 0.08% | 0.09% |  |
| B | 23856 | 22154 | 0 | 0 | 0.00% | 0.00% |  |
| C | 23856 | 22153 | 4 | 4 | 0.02% | 0.02% |  |
| D | 23856 | 22151 | 54 | 54 | 0.23% | 0.24% |  |
Top three noisy pixels from each quadrant. If the there are fewer than three noisy pixels in the level2.evt file, extra rows are filled as -1
| Pixel properties | Quadrant properties | ||||||
|---|---|---|---|---|---|---|---|
| Quadrant | DetID | PixID | Counts | Sigma | Mean | Median | Sigma |
| A | 4 | 2 | 167416 | 667.94 | 1132 | 1111 | 249.0 |
| A | 5 | 16 | 136068 | 542.03 | 1132 | 1111 | 249.0 |
| A | 15 | 174 | 56338 | 221.81 | 1132 | 1111 | 249.0 |
| B | 0 | 197 | 105655 | 483.49 | 1136 | 1108 | 216.2 |
| B | 4 | 216 | 66814 | 303.87 | 1136 | 1108 | 216.2 |
| B | 0 | 230 | 52283 | 236.67 | 1136 | 1108 | 216.2 |
| C | 0 | 207 | 138597 | 527.08 | 1093 | 1085 | 260.9 |
| C | 3 | 233 | 116236 | 441.37 | 1093 | 1085 | 260.9 |
| C | 7 | 247 | 34341 | 127.47 | 1093 | 1085 | 260.9 |
| D | 10 | 66 | 12716869 | 64036.94 | 815 | 789 | 198.6 |
| D | 7 | 238 | 3654020 | 18397.31 | 815 | 789 | 198.6 |
| D | 1 | 52 | 658052 | 3309.91 | 815 | 789 | 198.6 |
Histogram calculated using DETX and DETY for each event in the final _common_clean file
| Quadrant A |  |
 |
Quadrant B |
|---|---|---|---|
| Quadrant D |  |
 |
Quadrant C |
| Plot type | Count rate plots | Images |
|---|---|---|
| Comparison with Poisson distribution Blue bars denote a histogram of data divided into 1 sec bins. Red curve is a Poisson curve with rate = median count rate of data. |
 |
 |
| Quadrant-wise count rates Data is divided into 100 sec bins |
 |
|
| Module-wise count rates for Quadrant A Data is divided into 100 sec bins |
 |
 |
| Module-wise count rates for Quadrant B Data is divided into 100 sec bins |
 |
 |
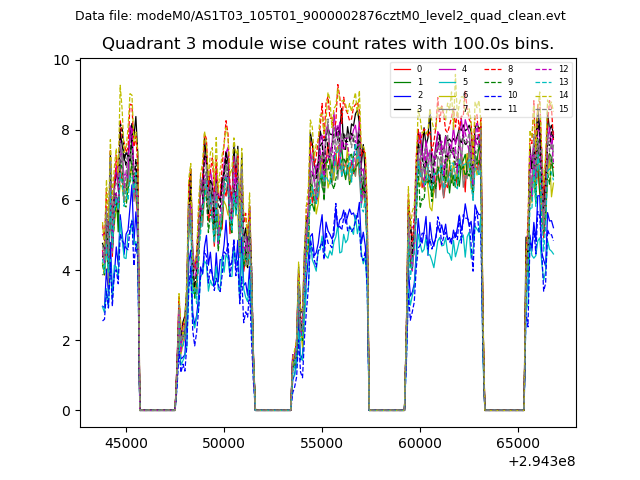
| Module-wise count rates for Quadrant C Data is divided into 100 sec bins |
 |
 |
| Module-wise count rates for Quadrant D Data is divided into 100 sec bins |
 |
 |
| Parameter | Plot |
|---|---|
| CZT HV Monitor |  |
| D_VDD | 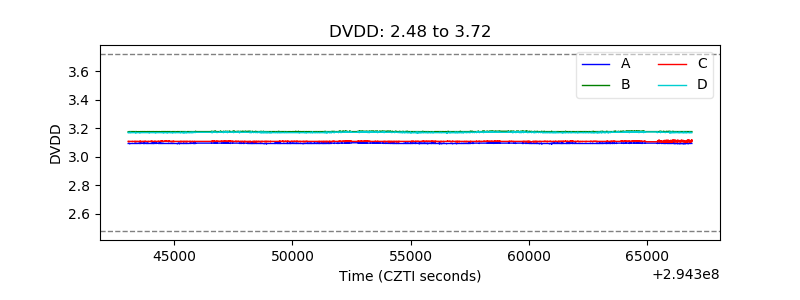 |
| Temperature 1 |  |
| Veto HV Monitor |  |
| Veto LLD |  |
| Alpha Counter |  |
| _CPM_Rate | 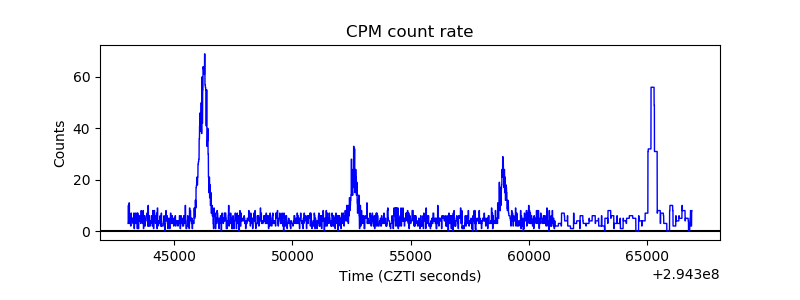 |
| CZT Counter |  |
| +2.5 Volts monitor |  |
| +5 Volts monitor |  |
| _ROLL_ROT |  |
| _Roll_DEC | 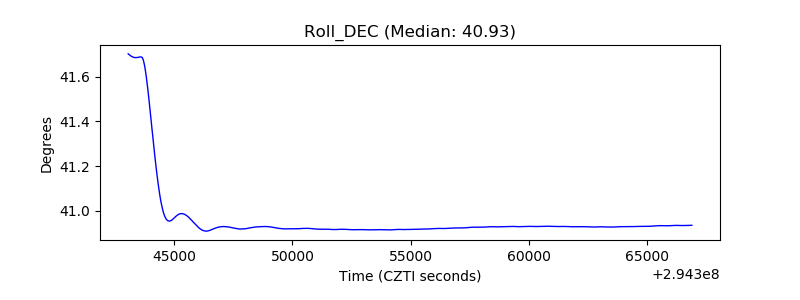 |
| _Roll_RA |  |
| Veto Counter |  |