| Param | Original file | Final file |
|---|---|---|
| Filename | modeM0/AS1C04_009T04_9000002866cztM0_level2_bc.evt | modeM0/AS1C04_009T04_9000002866cztM0_level2_quad_clean.evt |
| Size (bytes) | 567,437,760 | 167,512,320 |
| Size | 541.2 MB | 159.8 MB |
| Events in quadrant A | 1,949,220 | 1,235,000 |
| Events in quadrant B | 2,065,688 | 1,234,231 |
| Events in quadrant C | 1,813,730 | 1,166,821 |
| Events in quadrant D | 10,760,688 | 836,494 |
| Mode SS | |||
|---|---|---|---|
| Quadrant | BADHDUFLAG | Total packets | Discarded packets |
| A | 0 | 176 | 0 |
| B | 0 | 176 | 0 |
| C | 0 | 176 | 0 |
| D | 0 | 176 | 0 |
| Mode M0 | |||
|---|---|---|---|
| Quadrant | BADHDUFLAG | Total packets | Discarded packets |
| A | 0 | 18034 | 0 |
| B | 0 | 18433 | 0 |
| C | 0 | 17773 | 0 |
| D | 0 | 57993 | 0 |
| Mode M9 | |||
|---|---|---|---|
| Quadrant | BADHDUFLAG | Total packets | Discarded packets |
| A | 0 | 23 | 0 |
| B | 0 | 23 | 0 |
| C | 0 | 23 | 0 |
| D | 0 | 23 | 0 |
| Quadrant | Total seconds | Saturated seconds | Saturation percentage |
|---|---|---|---|
| A | 8630 | 61 | 0.706837% |
| B | 8630 | 84 | 0.973349% |
| C | 8630 | 64 | 0.741599% |
| D | 8630 | 5511 | 63.858633% |
Noise dominated data is calculated using 1-second bins in cleaned event files. If a bin has >2000 counts, and if more than 50% of those come from <1% of pixels, then it is considered to be noise-dominated and hence unusable.
| Quadrant | # 1 sec bins | Bins with >0 counts | Bins with >2000 counts | High rate bins dominated by noise | Noise dominated (total time) | Noise dominated (detector-on time) | Marked lightcurve |
|---|---|---|---|---|---|---|---|
| A | 10930 | 8629 | 0 | 0 | 0.00% | 0.00% |  |
| B | 10930 | 8629 | 5 | 5 | 0.05% | 0.06% |  |
| C | 10930 | 8629 | 1 | 1 | 0.01% | 0.01% | 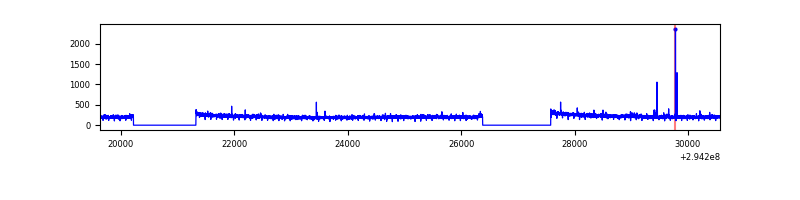 |
| D | 10929 | 8627 | 118 | 118 | 1.08% | 1.37% | 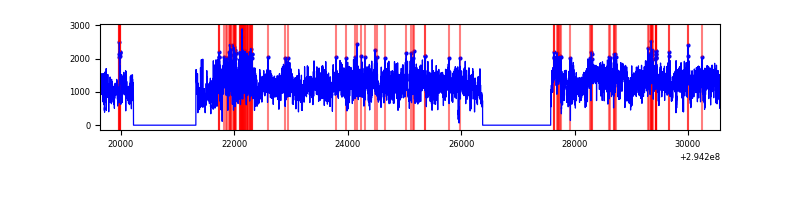 |
Top three noisy pixels from each quadrant. If the there are fewer than three noisy pixels in the level2.evt file, extra rows are filled as -1
| Pixel properties | Quadrant properties | ||||||
|---|---|---|---|---|---|---|---|
| Quadrant | DetID | PixID | Counts | Sigma | Mean | Median | Sigma |
| A | 5 | 16 | 9401 | 82.42 | 498 | 491 | 108.1 |
| A | 12 | 96 | 9356 | 82.0 | 498 | 491 | 108.1 |
| A | 13 | 254 | 8643 | 75.4 | 498 | 491 | 108.1 |
| B | 7 | 220 | 39973 | 415.14 | 493 | 483 | 95.1 |
| B | 15 | 32 | 37466 | 388.79 | 493 | 483 | 95.1 |
| B | 4 | 216 | 27476 | 283.77 | 493 | 483 | 95.1 |
| C | 5 | 112 | 15881 | 138.97 | 465 | 463 | 110.9 |
| C | 4 | 175 | 5030 | 41.16 | 465 | 463 | 110.9 |
| C | 3 | 233 | 3744 | 29.57 | 465 | 463 | 110.9 |
| D | 10 | 66 | 7017786 | 78717.87 | 364 | 351 | 89.1 |
| D | 7 | 238 | 1770063 | 19851.69 | 364 | 351 | 89.1 |
| D | 1 | 52 | 206459 | 2312.01 | 364 | 351 | 89.1 |
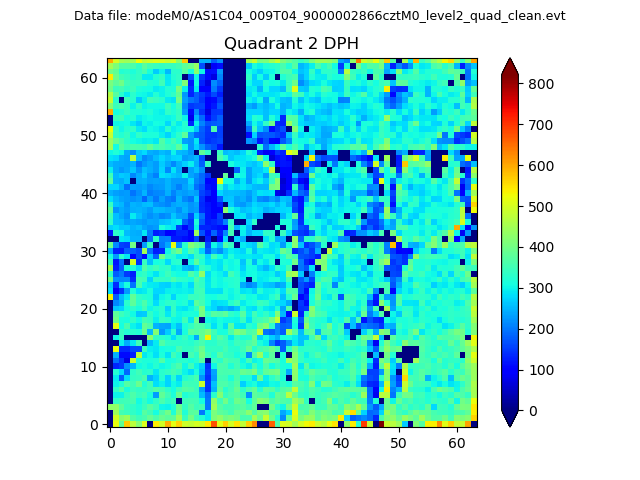
Histogram calculated using DETX and DETY for each event in the final _common_clean file
| Quadrant A |  |
 |
Quadrant B |
|---|---|---|---|
| Quadrant D |  |
 |
Quadrant C |
| Plot type | Count rate plots | Images |
|---|---|---|
| Comparison with Poisson distribution Blue bars denote a histogram of data divided into 1 sec bins. Red curve is a Poisson curve with rate = median count rate of data. |
 |
 |
| Quadrant-wise count rates Data is divided into 100 sec bins |
 |
|
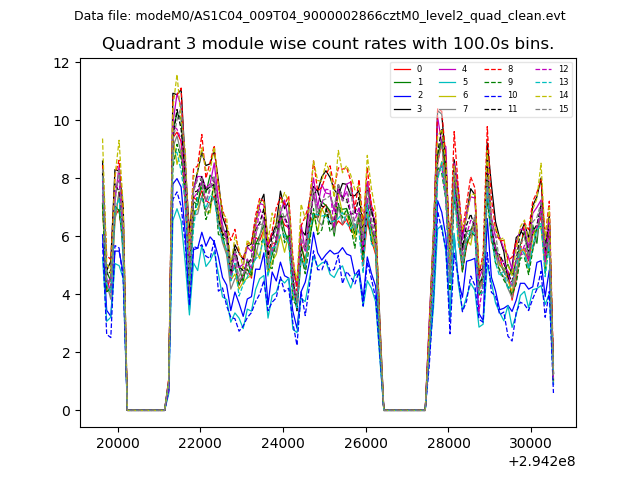
| Module-wise count rates for Quadrant A Data is divided into 100 sec bins |
 |
 |
| Module-wise count rates for Quadrant B Data is divided into 100 sec bins |
 |
 |
| Module-wise count rates for Quadrant C Data is divided into 100 sec bins |
 |
 |
| Module-wise count rates for Quadrant D Data is divided into 100 sec bins |
 |
 |
| Parameter | Plot |
|---|---|
| CZT HV Monitor |  |
| D_VDD |  |
| Temperature 1 |  |
| Veto HV Monitor |  |
| Veto LLD | 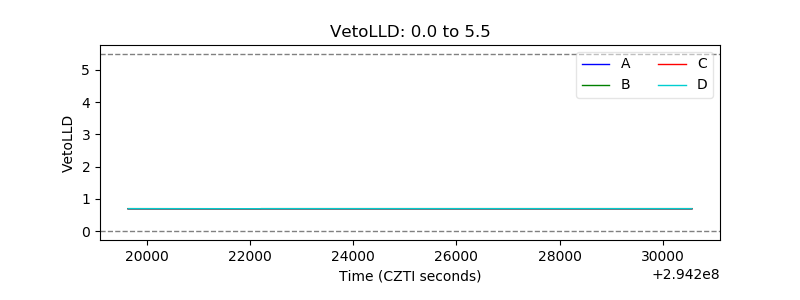 |
| Alpha Counter |  |
| _CPM_Rate | 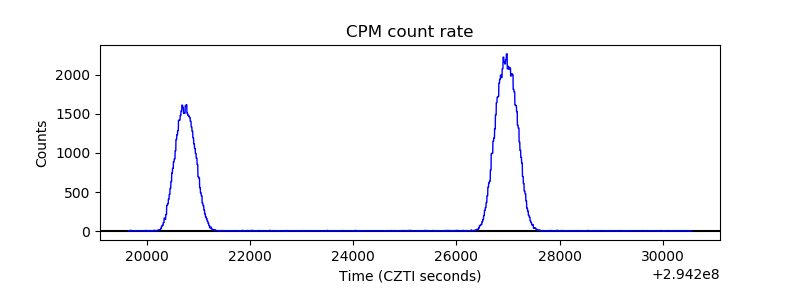 |
| CZT Counter |  |
| +2.5 Volts monitor |  |
| +5 Volts monitor | 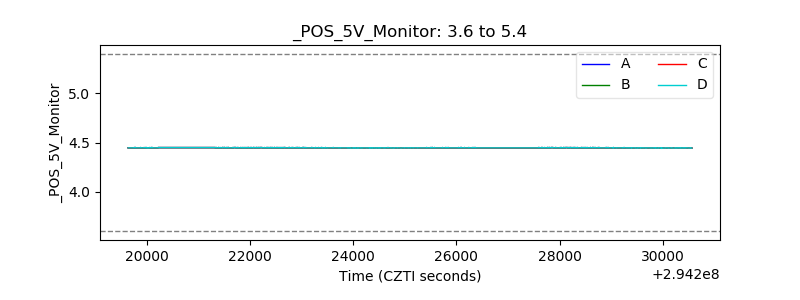 |
| _ROLL_ROT |  |
| _Roll_DEC |  |
| _Roll_RA |  |
| Veto Counter |  |