| Param | Original file | Final file |
|---|---|---|
| Filename | modeM0/AS1A05_227T03_9000002872cztM0_level2_bc.evt | modeM0/AS1A05_227T03_9000002872cztM0_level2_quad_clean.evt |
| Size (bytes) | 320,440,320 | 61,076,160 |
| Size | 305.6 MB | 58.2 MB |
| Events in quadrant A | 926,964 | 442,179 |
| Events in quadrant B | 1,026,324 | 448,708 |
| Events in quadrant C | 878,584 | 426,387 |
| Events in quadrant D | 6,555,284 | 212,173 |
| Mode SS | |||
|---|---|---|---|
| Quadrant | BADHDUFLAG | Total packets | Discarded packets |
| A | 0 | 94 | 0 |
| B | 0 | 94 | 0 |
| C | 0 | 94 | 0 |
| D | 0 | 94 | 0 |
| Mode M9 | |||
|---|---|---|---|
| Quadrant | BADHDUFLAG | Total packets | Discarded packets |
| A | 0 | 1 | 0 |
| B | 0 | 1 | 0 |
| C | 0 | 1 | 0 |
| D | 0 | 1 | 0 |
| Mode M0 | |||
|---|---|---|---|
| Quadrant | BADHDUFLAG | Total packets | Discarded packets |
| A | 0 | 9392 | 0 |
| B | 0 | 9776 | 0 |
| C | 0 | 9348 | 0 |
| D | 0 | 34095 | 0 |
| Quadrant | Total seconds | Saturated seconds | Saturation percentage |
|---|---|---|---|
| A | 4523 | 57 | 1.260226% |
| B | 4523 | 110 | 2.432014% |
| C | 4523 | 104 | 2.299359% |
| D | 4523 | 4045 | 89.431793% |
Noise dominated data is calculated using 1-second bins in cleaned event files. If a bin has >2000 counts, and if more than 50% of those come from <1% of pixels, then it is considered to be noise-dominated and hence unusable.
| Quadrant | # 1 sec bins | Bins with >0 counts | Bins with >2000 counts | High rate bins dominated by noise | Noise dominated (total time) | Noise dominated (detector-on time) | Marked lightcurve |
|---|---|---|---|---|---|---|---|
| A | 4633 | 4524 | 0 | 0 | 0.00% | 0.00% |  |
| B | 4633 | 4522 | 0 | 0 | 0.00% | 0.00% |  |
| C | 4633 | 4524 | 0 | 0 | 0.00% | 0.00% |  |
| D | 4633 | 4522 | 58 | 58 | 1.25% | 1.28% |  |
Top three noisy pixels from each quadrant. If the there are fewer than three noisy pixels in the level2.evt file, extra rows are filled as -1
| Pixel properties | Quadrant properties | ||||||
|---|---|---|---|---|---|---|---|
| Quadrant | DetID | PixID | Counts | Sigma | Mean | Median | Sigma |
| A | 5 | 16 | 8014 | 143.38 | 236 | 231 | 54.3 |
| A | 13 | 254 | 5286 | 93.13 | 236 | 231 | 54.3 |
| A | 11 | 29 | 4489 | 78.44 | 236 | 231 | 54.3 |
| B | 15 | 32 | 30917 | 639.8 | 238 | 232 | 48.0 |
| B | 7 | 220 | 16069 | 330.21 | 238 | 232 | 48.0 |
| B | 4 | 216 | 13591 | 278.54 | 238 | 232 | 48.0 |
| C | 3 | 233 | 6237 | 108.12 | 226 | 223 | 55.6 |
| C | 13 | 61 | 1327 | 19.85 | 226 | 223 | 55.6 |
| C | 12 | 2 | 1150 | 16.67 | 226 | 223 | 55.6 |
| D | 10 | 66 | 4464038 | 126691.31 | 137 | 132 | 35.2 |
| D | 7 | 238 | 1354156 | 38428.92 | 137 | 132 | 35.2 |
| D | 1 | 52 | 142521 | 4041.18 | 137 | 132 | 35.2 |
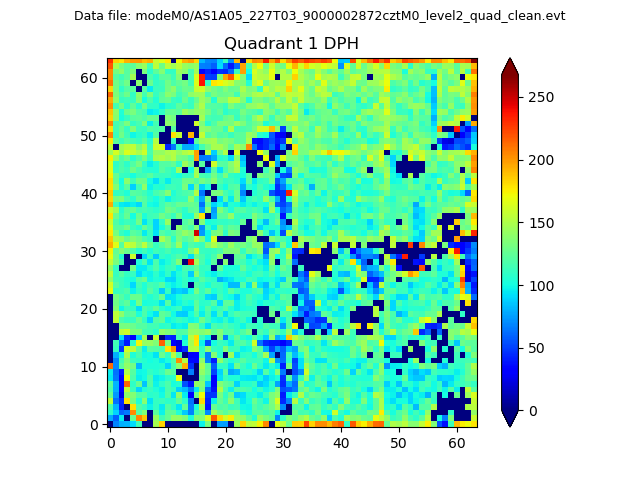
Histogram calculated using DETX and DETY for each event in the final _common_clean file
| Quadrant A |  |
 |
Quadrant B |
|---|---|---|---|
| Quadrant D |  |
 |
Quadrant C |
| Plot type | Count rate plots | Images |
|---|---|---|
| Comparison with Poisson distribution Blue bars denote a histogram of data divided into 1 sec bins. Red curve is a Poisson curve with rate = median count rate of data. |
 |
 |
| Quadrant-wise count rates Data is divided into 100 sec bins |
 |
|
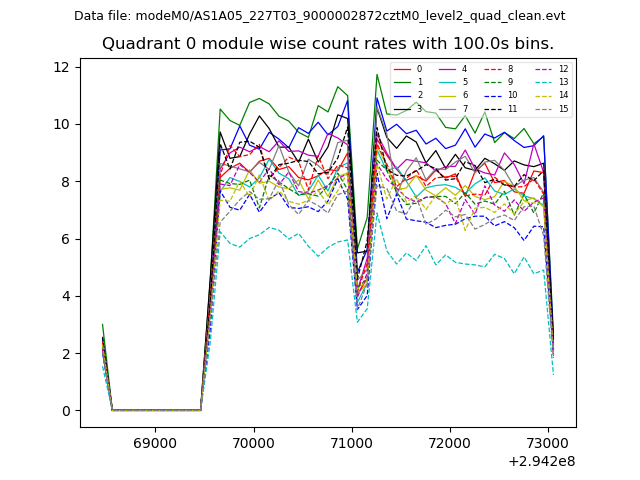
| Module-wise count rates for Quadrant A Data is divided into 100 sec bins |
 |
 |
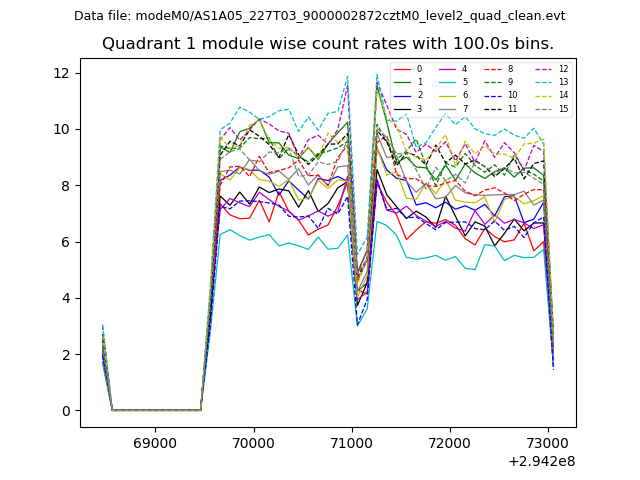
| Module-wise count rates for Quadrant B Data is divided into 100 sec bins |
 |
 |
| Module-wise count rates for Quadrant C Data is divided into 100 sec bins |
 |
 |
| Module-wise count rates for Quadrant D Data is divided into 100 sec bins |
 |
 |
| Parameter | Plot |
|---|---|
| CZT HV Monitor | 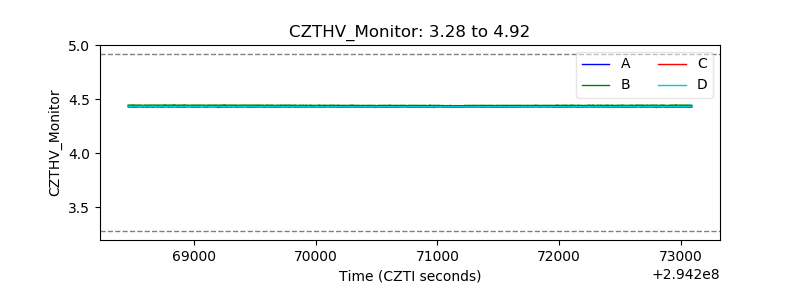 |
| D_VDD |  |
| Temperature 1 |  |
| Veto HV Monitor | 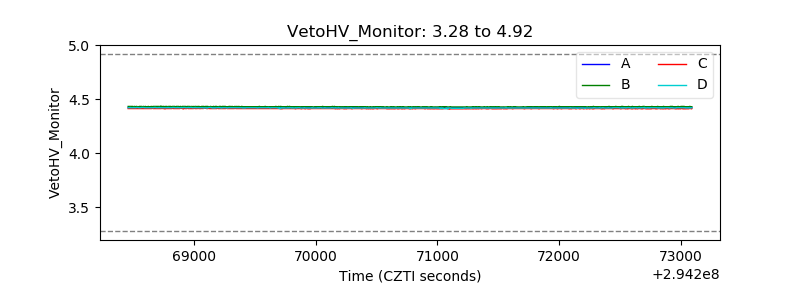 |
| Veto LLD |  |
| Alpha Counter |  |
| _CPM_Rate |  |
| CZT Counter |  |
| +2.5 Volts monitor |  |
| +5 Volts monitor |  |
| _ROLL_ROT | 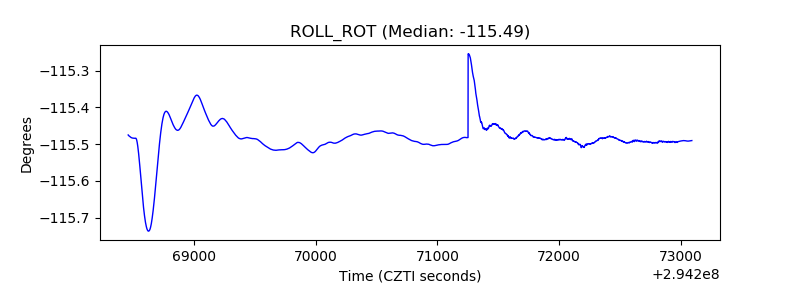 |
| _Roll_DEC | 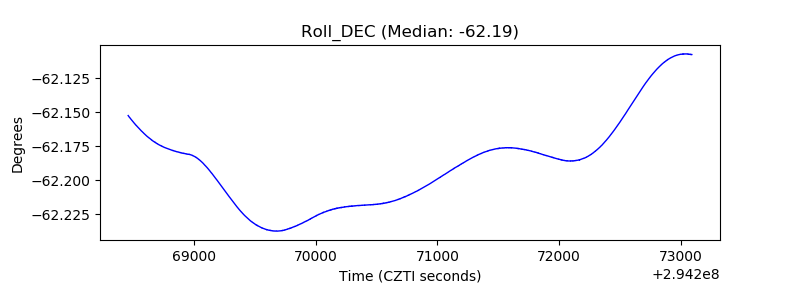 |
| _Roll_RA | 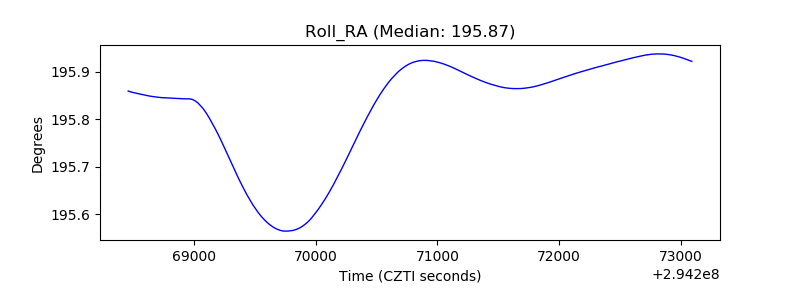 |
| Veto Counter |  |