| Param | Original file | Final file |
|---|---|---|
| Filename | modeM0/AS1A05_208T03_9000002874cztM0_level2_bc.evt | modeM0/AS1A05_208T03_9000002874cztM0_level2_quad_clean.evt |
| Size (bytes) | 3,325,412,160 | 761,014,080 |
| Size | 3.1 GB | 725.8 MB |
| Events in quadrant A | 12,473,221 | 5,256,646 |
| Events in quadrant B | 12,460,876 | 5,285,662 |
| Events in quadrant C | 11,814,987 | 5,033,454 |
| Events in quadrant D | 60,077,437 | 3,562,055 |
| Mode M9 | |||
|---|---|---|---|
| Quadrant | BADHDUFLAG | Total packets | Discarded packets |
| A | 0 | 108 | 0 |
| B | 0 | 108 | 0 |
| C | 0 | 108 | 0 |
| D | 0 | 108 | 0 |
| Mode M0 | |||
|---|---|---|---|
| Quadrant | BADHDUFLAG | Total packets | Discarded packets |
| A | 0 | 119839 | 0 |
| B | 0 | 119629 | 0 |
| C | 0 | 119017 | 0 |
| D | 0 | 347073 | 0 |
| Mode SS | |||
|---|---|---|---|
| Quadrant | BADHDUFLAG | Total packets | Discarded packets |
| A | 0 | 1160 | 0 |
| B | 0 | 1160 | 0 |
| C | 0 | 1160 | 0 |
| D | 0 | 1160 | 0 |
| Quadrant | Total seconds | Saturated seconds | Saturation percentage |
|---|---|---|---|
| A | 56887 | 577 | 1.014291% |
| B | 56887 | 621 | 1.091638% |
| C | 56887 | 802 | 1.409812% |
| D | 56887 | 32228 | 56.652662% |
Noise dominated data is calculated using 1-second bins in cleaned event files. If a bin has >2000 counts, and if more than 50% of those come from <1% of pixels, then it is considered to be noise-dominated and hence unusable.
| Quadrant | # 1 sec bins | Bins with >0 counts | Bins with >2000 counts | High rate bins dominated by noise | Noise dominated (total time) | Noise dominated (detector-on time) | Marked lightcurve |
|---|---|---|---|---|---|---|---|
| A | 67677 | 56884 | 17 | 17 | 0.03% | 0.03% |  |
| B | 67677 | 56877 | 0 | 0 | 0.00% | 0.00% |  |
| C | 67677 | 56878 | 0 | 0 | 0.00% | 0.00% | 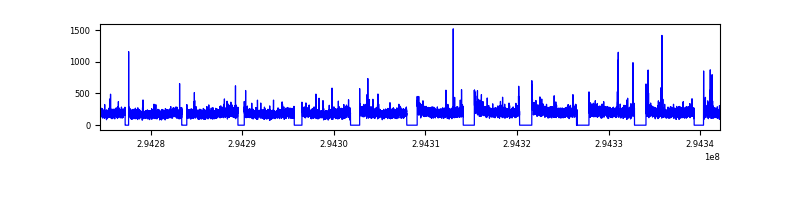 |
| D | 67676 | 56877 | 487 | 487 | 0.72% | 0.86% |  |
Top three noisy pixels from each quadrant. If the there are fewer than three noisy pixels in the level2.evt file, extra rows are filled as -1
| Pixel properties | Quadrant properties | ||||||
|---|---|---|---|---|---|---|---|
| Quadrant | DetID | PixID | Counts | Sigma | Mean | Median | Sigma |
| A | 5 | 16 | 182309 | 265.77 | 3155 | 3103 | 674.3 |
| A | 12 | 96 | 88219 | 126.23 | 3155 | 3103 | 674.3 |
| A | 13 | 254 | 73463 | 104.34 | 3155 | 3103 | 674.3 |
| B | 0 | 198 | 100478 | 167.11 | 3159 | 3091 | 582.8 |
| B | 0 | 230 | 59158 | 96.21 | 3159 | 3091 | 582.8 |
| B | 0 | 229 | 58074 | 94.35 | 3159 | 3091 | 582.8 |
| C | 3 | 233 | 135931 | 188.77 | 3010 | 2998 | 704.2 |
| C | 7 | 247 | 33559 | 43.4 | 3010 | 2998 | 704.2 |
| C | 13 | 61 | 17501 | 20.6 | 3010 | 2998 | 704.2 |
| D | 10 | 66 | 35058268 | 62764.89 | 2359 | 2279 | 558.5 |
| D | 7 | 238 | 10916182 | 19540.45 | 2359 | 2279 | 558.5 |
| D | 1 | 52 | 4076450 | 7294.47 | 2359 | 2279 | 558.5 |
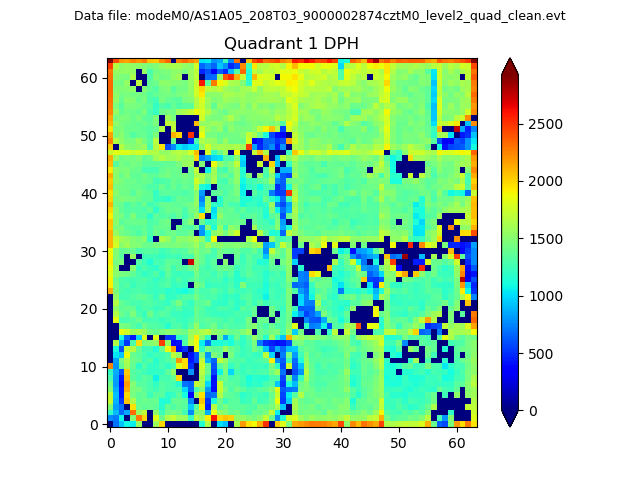
Histogram calculated using DETX and DETY for each event in the final _common_clean file
| Quadrant A |  |
 |
Quadrant B |
|---|---|---|---|
| Quadrant D |  |
 |
Quadrant C |
| Plot type | Count rate plots | Images |
|---|---|---|
| Comparison with Poisson distribution Blue bars denote a histogram of data divided into 1 sec bins. Red curve is a Poisson curve with rate = median count rate of data. |
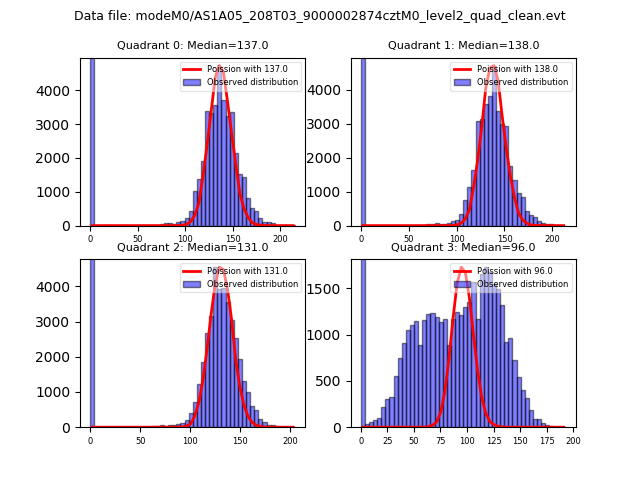 |
 |
| Quadrant-wise count rates Data is divided into 100 sec bins |
 |
|
| Module-wise count rates for Quadrant A Data is divided into 100 sec bins |
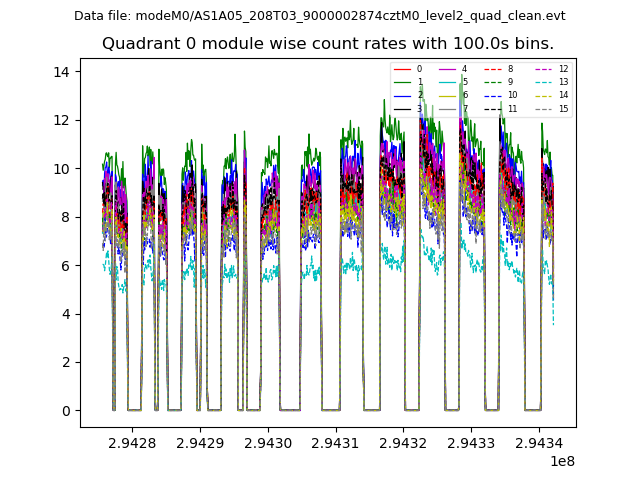 |
 |
| Module-wise count rates for Quadrant B Data is divided into 100 sec bins |
 |
 |
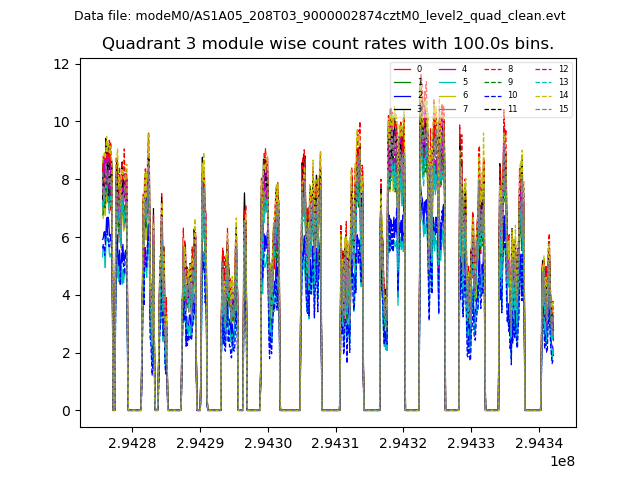
| Module-wise count rates for Quadrant C Data is divided into 100 sec bins |
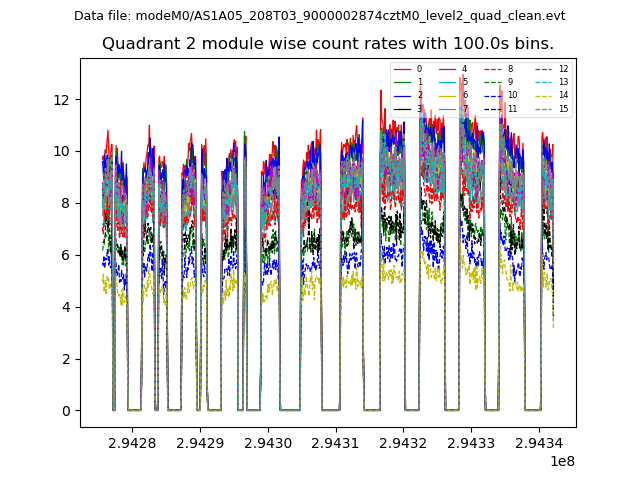 |
 |
| Module-wise count rates for Quadrant D Data is divided into 100 sec bins |
 |
 |
| Parameter | Plot |
|---|---|
| CZT HV Monitor | 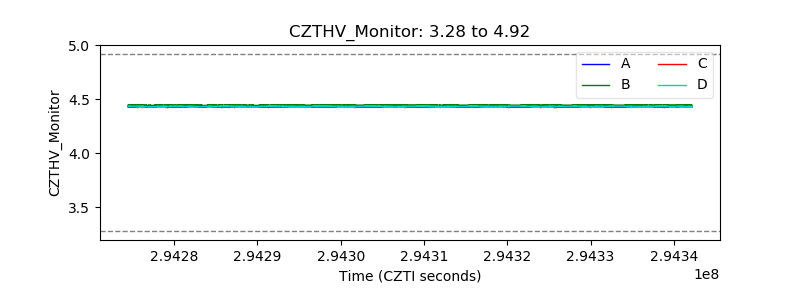 |
| D_VDD |  |
| Temperature 1 |  |
| Veto HV Monitor | 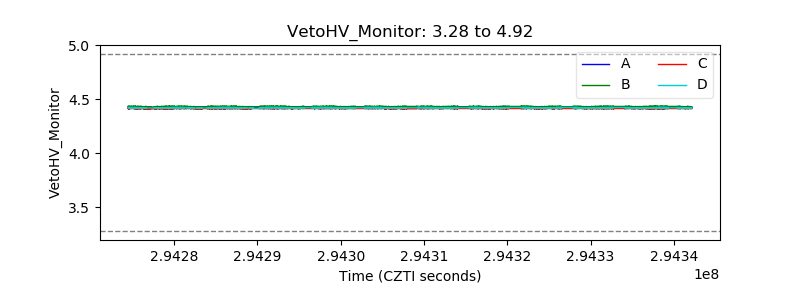 |
| Veto LLD |  |
| Alpha Counter |  |
| _CPM_Rate |  |
| CZT Counter | 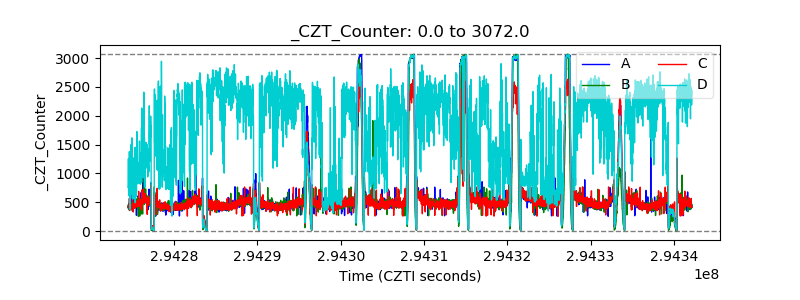 |
| +2.5 Volts monitor |  |
| +5 Volts monitor | 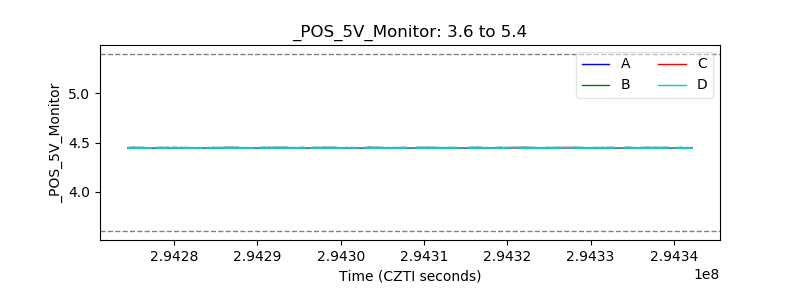 |
| _ROLL_ROT | 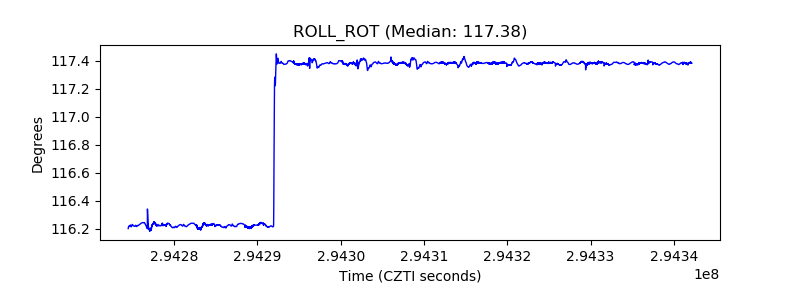 |
| _Roll_DEC |  |
| _Roll_RA |  |
| Veto Counter |  |