| Param | Original file | Final file |
|---|---|---|
| Filename | modeM0/AS1A05_025T17_9000002868cztM0_level2_bc.evt | modeM0/AS1A05_025T17_9000002868cztM0_level2_quad_clean.evt |
| Size (bytes) | 892,543,680 | 266,976,000 |
| Size | 851.2 MB | 254.6 MB |
| Events in quadrant A | 3,291,288 | 2,028,305 |
| Events in quadrant B | 3,381,090 | 2,043,955 |
| Events in quadrant C | 2,959,711 | 1,917,325 |
| Events in quadrant D | 16,495,009 | 1,185,234 |
| Mode M0 | |||
|---|---|---|---|
| Quadrant | BADHDUFLAG | Total packets | Discarded packets |
| A | 0 | 28767 | 0 |
| B | 0 | 29143 | 0 |
| C | 0 | 28238 | 0 |
| D | 0 | 92797 | 0 |
| Mode SS | |||
|---|---|---|---|
| Quadrant | BADHDUFLAG | Total packets | Discarded packets |
| A | 0 | 268 | 0 |
| B | 0 | 268 | 0 |
| C | 0 | 268 | 0 |
| D | 0 | 268 | 0 |
| Mode M9 | |||
|---|---|---|---|
| Quadrant | BADHDUFLAG | Total packets | Discarded packets |
| A | 0 | 39 | 0 |
| B | 0 | 39 | 0 |
| C | 0 | 39 | 0 |
| D | 0 | 39 | 0 |
| Quadrant | Total seconds | Saturated seconds | Saturation percentage |
|---|---|---|---|
| A | 13137 | 304 | 2.314075% |
| B | 13137 | 329 | 2.504377% |
| C | 13137 | 358 | 2.725128% |
| D | 13137 | 10001 | 76.128492% |
Noise dominated data is calculated using 1-second bins in cleaned event files. If a bin has >2000 counts, and if more than 50% of those come from <1% of pixels, then it is considered to be noise-dominated and hence unusable.
| Quadrant | # 1 sec bins | Bins with >0 counts | Bins with >2000 counts | High rate bins dominated by noise | Noise dominated (total time) | Noise dominated (detector-on time) | Marked lightcurve |
|---|---|---|---|---|---|---|---|
| A | 17042 | 13134 | 6 | 6 | 0.04% | 0.05% |  |
| B | 17042 | 13134 | 0 | 0 | 0.00% | 0.00% | 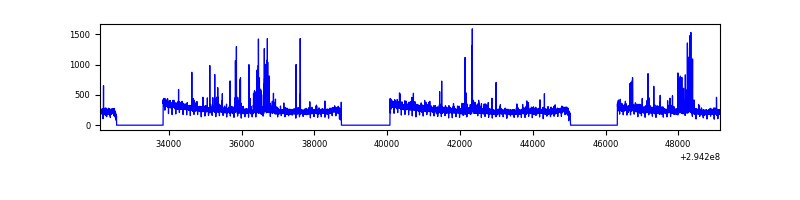 |
| C | 17042 | 13134 | 0 | 0 | 0.00% | 0.00% |  |
| D | 17042 | 13134 | 153 | 153 | 0.90% | 1.16% |  |
Top three noisy pixels from each quadrant. If the there are fewer than three noisy pixels in the level2.evt file, extra rows are filled as -1
| Pixel properties | Quadrant properties | ||||||
|---|---|---|---|---|---|---|---|
| Quadrant | DetID | PixID | Counts | Sigma | Mean | Median | Sigma |
| A | 5 | 16 | 101774 | 577.01 | 819 | 810 | 175.0 |
| A | 15 | 174 | 26616 | 147.48 | 819 | 810 | 175.0 |
| A | 13 | 254 | 13437 | 72.16 | 819 | 810 | 175.0 |
| B | 0 | 197 | 44644 | 290.01 | 819 | 807 | 151.2 |
| B | 7 | 220 | 39120 | 253.46 | 819 | 807 | 151.2 |
| B | 4 | 216 | 37068 | 239.89 | 819 | 807 | 151.2 |
| C | 3 | 233 | 13453 | 70.99 | 765 | 767 | 178.7 |
| C | 5 | 4 | 4620 | 21.56 | 765 | 767 | 178.7 |
| C | 13 | 61 | 4576 | 21.31 | 765 | 767 | 178.7 |
| D | 10 | 66 | 10099837 | 81714.59 | 517 | 503 | 123.6 |
| D | 7 | 238 | 3843956 | 31097.71 | 517 | 503 | 123.6 |
| D | 1 | 52 | 373992 | 3021.93 | 517 | 503 | 123.6 |
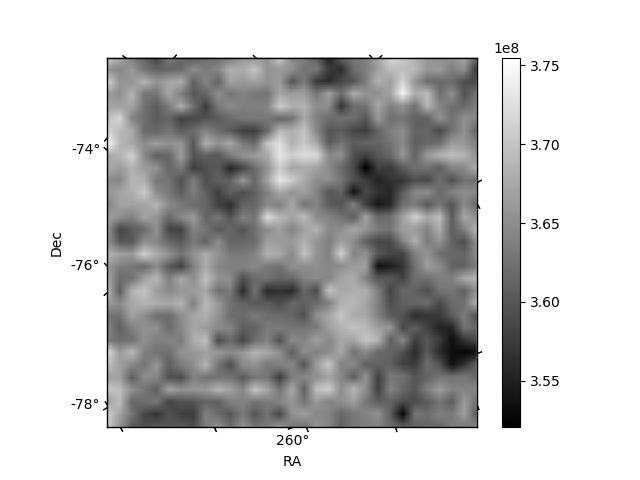
Histogram calculated using DETX and DETY for each event in the final _common_clean file
| Quadrant A |  |
 |
Quadrant B |
|---|---|---|---|
| Quadrant D |  |
 |
Quadrant C |
| Plot type | Count rate plots | Images |
|---|---|---|
| Comparison with Poisson distribution Blue bars denote a histogram of data divided into 1 sec bins. Red curve is a Poisson curve with rate = median count rate of data. |
 |
 |
| Quadrant-wise count rates Data is divided into 100 sec bins |
 |
|
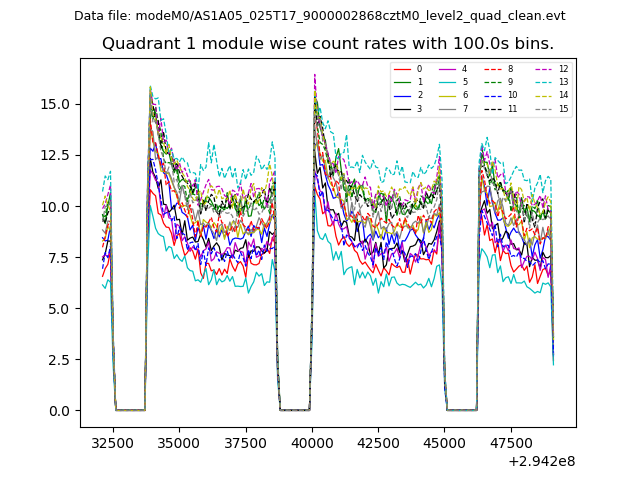
| Module-wise count rates for Quadrant A Data is divided into 100 sec bins |
 |
 |
| Module-wise count rates for Quadrant B Data is divided into 100 sec bins |
 |
 |
| Module-wise count rates for Quadrant C Data is divided into 100 sec bins |
 |
 |
| Module-wise count rates for Quadrant D Data is divided into 100 sec bins |
 |
 |
| Parameter | Plot |
|---|---|
| CZT HV Monitor |  |
| D_VDD | 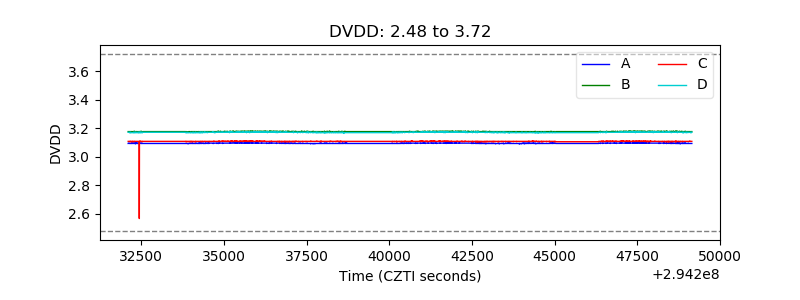 |
| Temperature 1 | 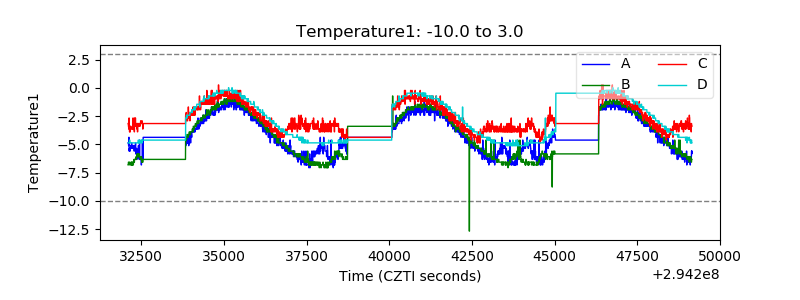 |
| Veto HV Monitor |  |
| Veto LLD |  |
| Alpha Counter | 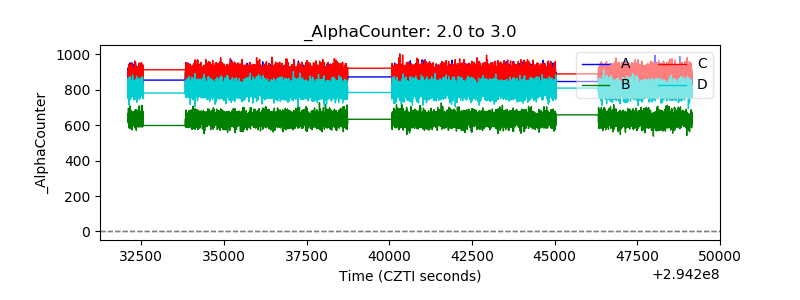 |
| _CPM_Rate |  |
| CZT Counter |  |
| +2.5 Volts monitor | 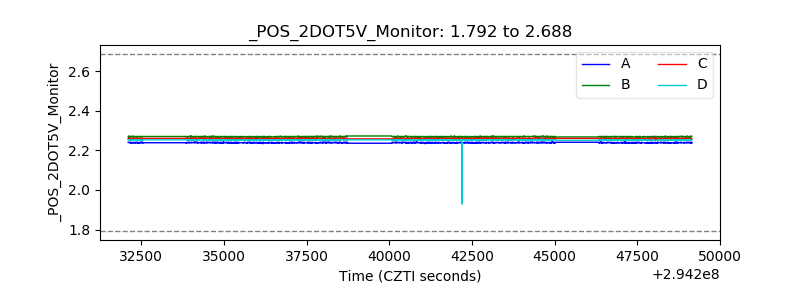 |
| +5 Volts monitor |  |
| _ROLL_ROT |  |
| _Roll_DEC |  |
| _Roll_RA | 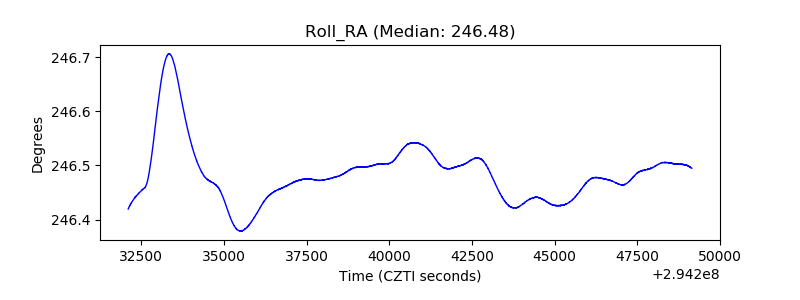 |
| Veto Counter | 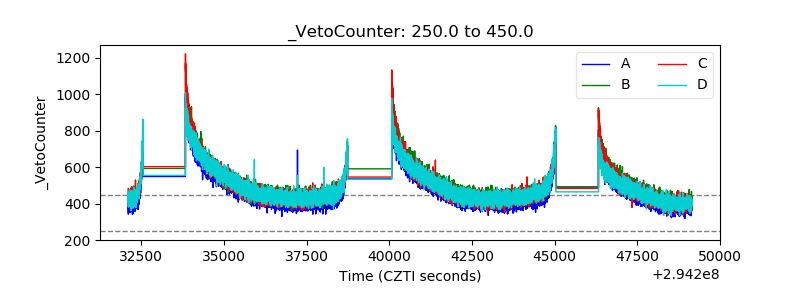 |