| Param | Original file | Final file |
|---|---|---|
| Filename | modeM0/AS1A05_227T03_9000002862cztM0_level2_bc.evt | modeM0/AS1A05_227T03_9000002862cztM0_level2_quad_clean.evt |
| Size (bytes) | 228,723,840 | 75,548,160 |
| Size | 218.1 MB | 72.0 MB |
| Events in quadrant A | 989,208 | 512,094 |
| Events in quadrant B | 1,109,915 | 516,803 |
| Events in quadrant C | 963,179 | 486,882 |
| Events in quadrant D | 3,534,878 | 439,806 |
| Mode M0 | |||
|---|---|---|---|
| Quadrant | BADHDUFLAG | Total packets | Discarded packets |
| A | 0 | 9767 | 0 |
| B | 0 | 10214 | 0 |
| C | 0 | 9875 | 0 |
| D | 0 | 20335 | 0 |
| Mode M9 | |||
|---|---|---|---|
| Quadrant | BADHDUFLAG | Total packets | Discarded packets |
| A | 0 | 10 | 0 |
| B | 0 | 10 | 0 |
| C | 0 | 10 | 0 |
| D | 0 | 10 | 0 |
| Mode SS | |||
|---|---|---|---|
| Quadrant | BADHDUFLAG | Total packets | Discarded packets |
| A | 0 | 96 | 0 |
| B | 0 | 96 | 0 |
| C | 0 | 96 | 0 |
| D | 0 | 96 | 0 |
| Quadrant | Total seconds | Saturated seconds | Saturation percentage |
|---|---|---|---|
| A | 4732 | 37 | 0.781910% |
| B | 4732 | 71 | 1.500423% |
| C | 4732 | 61 | 1.289096% |
| D | 4732 | 858 | 18.131868% |
Noise dominated data is calculated using 1-second bins in cleaned event files. If a bin has >2000 counts, and if more than 50% of those come from <1% of pixels, then it is considered to be noise-dominated and hence unusable.
| Quadrant | # 1 sec bins | Bins with >0 counts | Bins with >2000 counts | High rate bins dominated by noise | Noise dominated (total time) | Noise dominated (detector-on time) | Marked lightcurve |
|---|---|---|---|---|---|---|---|
| A | 5747 | 4731 | 0 | 0 | 0.00% | 0.00% | 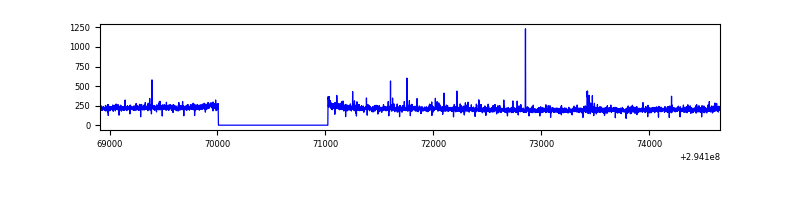 |
| B | 5747 | 4732 | 1 | 1 | 0.02% | 0.02% | 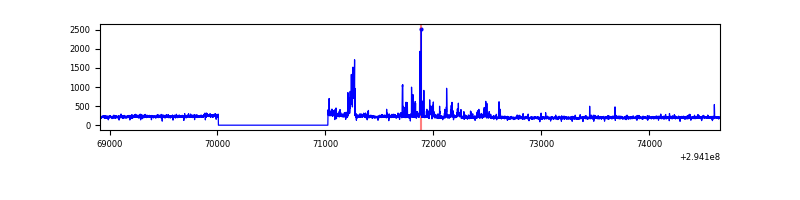 |
| C | 5747 | 4731 | 0 | 0 | 0.00% | 0.00% |  |
| D | 5747 | 4731 | 30 | 30 | 0.52% | 0.63% |  |
Top three noisy pixels from each quadrant. If the there are fewer than three noisy pixels in the level2.evt file, extra rows are filled as -1
| Pixel properties | Quadrant properties | ||||||
|---|---|---|---|---|---|---|---|
| Quadrant | DetID | PixID | Counts | Sigma | Mean | Median | Sigma |
| A | 13 | 254 | 4568 | 75.85 | 253 | 248 | 57.0 |
| A | 4 | 2 | 3609 | 59.01 | 253 | 248 | 57.0 |
| A | 5 | 16 | 3520 | 57.45 | 253 | 248 | 57.0 |
| B | 6 | 36 | 37037 | 718.91 | 256 | 250 | 51.2 |
| B | 4 | 216 | 31811 | 616.78 | 256 | 250 | 51.2 |
| B | 0 | 190 | 15732 | 302.56 | 256 | 250 | 51.2 |
| C | 3 | 233 | 26413 | 442.43 | 242 | 241 | 59.2 |
| C | 13 | 61 | 1489 | 21.1 | 242 | 241 | 59.2 |
| C | 9 | 160 | 1474 | 20.84 | 242 | 241 | 59.2 |
| D | 10 | 66 | 1521474 | 27607.4 | 227 | 219 | 55.1 |
| D | 7 | 238 | 644353 | 11689.6 | 227 | 219 | 55.1 |
| D | 1 | 52 | 286195 | 5189.83 | 227 | 219 | 55.1 |
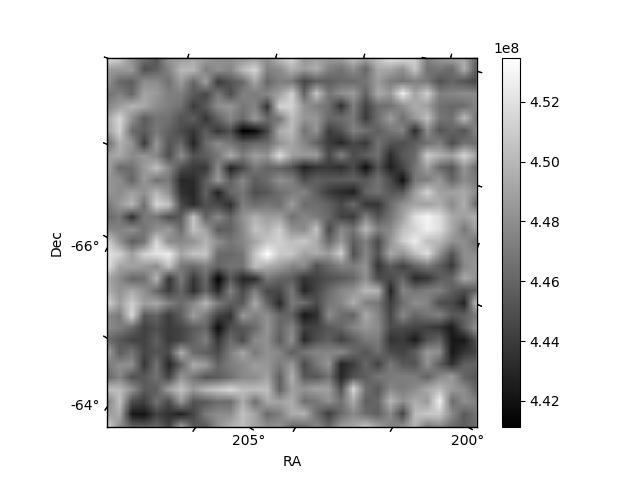
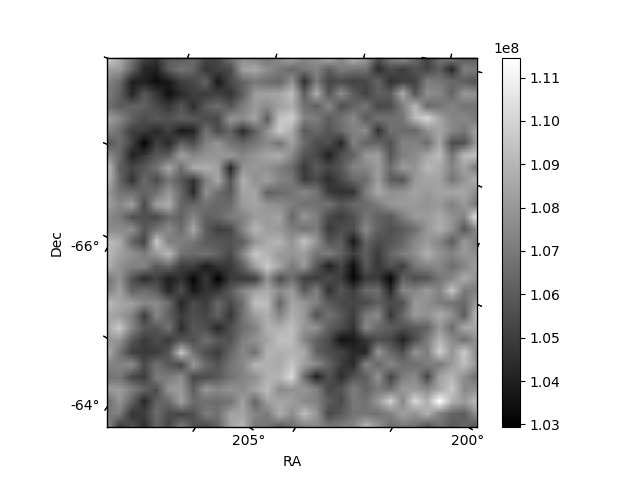
Histogram calculated using DETX and DETY for each event in the final _common_clean file
| Quadrant A |  |
 |
Quadrant B |
|---|---|---|---|
| Quadrant D |  |
 |
Quadrant C |
| Plot type | Count rate plots | Images |
|---|---|---|
| Comparison with Poisson distribution Blue bars denote a histogram of data divided into 1 sec bins. Red curve is a Poisson curve with rate = median count rate of data. |
 |
 |
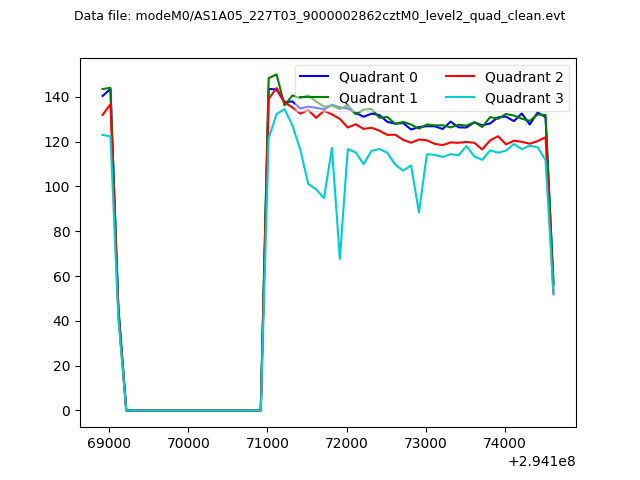
| Quadrant-wise count rates Data is divided into 100 sec bins |
 |
|
| Module-wise count rates for Quadrant A Data is divided into 100 sec bins |
 |
 |
| Module-wise count rates for Quadrant B Data is divided into 100 sec bins |
 |
 |
| Module-wise count rates for Quadrant C Data is divided into 100 sec bins |
 |
 |
| Module-wise count rates for Quadrant D Data is divided into 100 sec bins |
 |
 |
| Parameter | Plot |
|---|---|
| CZT HV Monitor |  |
| D_VDD | 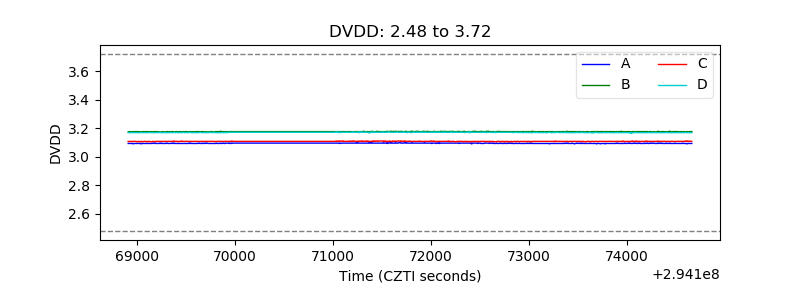 |
| Temperature 1 | 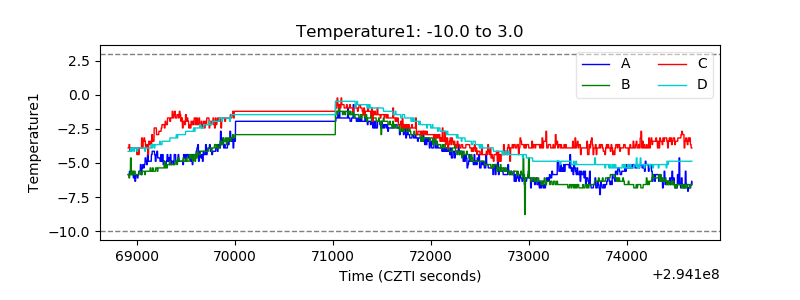 |
| Veto HV Monitor | 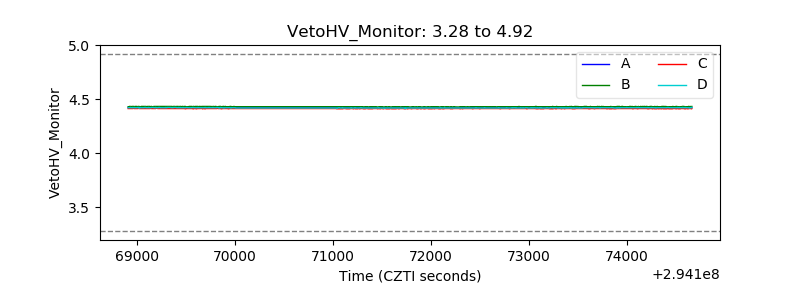 |
| Veto LLD |  |
| Alpha Counter | 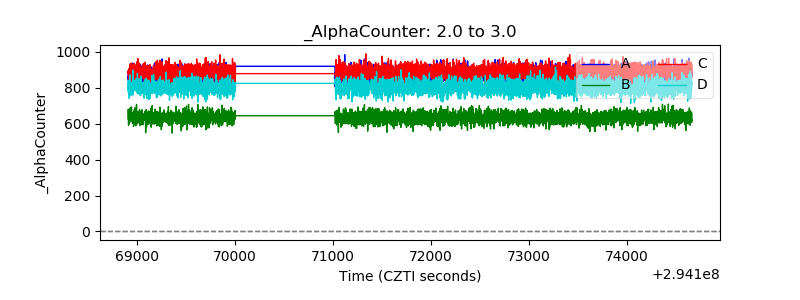 |
| _CPM_Rate |  |
| CZT Counter |  |
| +2.5 Volts monitor | 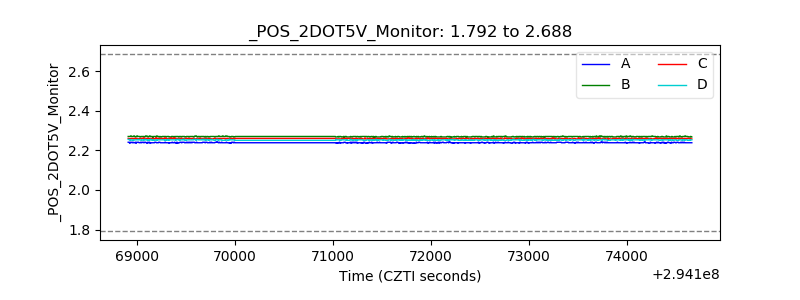 |
| +5 Volts monitor | 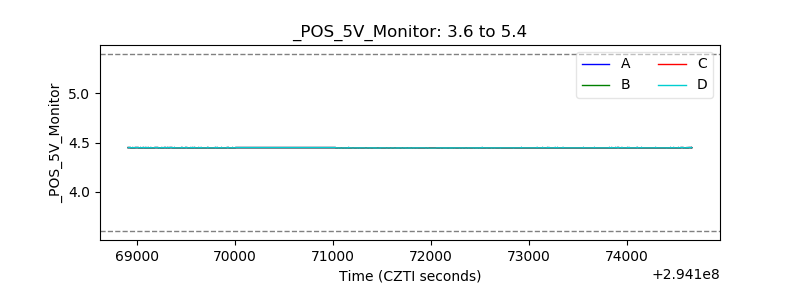 |
| _ROLL_ROT |  |
| _Roll_DEC |  |
| _Roll_RA |  |
| Veto Counter |  |