| Param | Original file | Final file |
|---|---|---|
| Filename | modeM0/AS1A05_226T06_9000002864cztM0_level2_bc.evt | modeM0/AS1A05_226T06_9000002864cztM0_level2_quad_clean.evt |
| Size (bytes) | 2,038,852,800 | 479,710,080 |
| Size | 1.9 GB | 457.5 MB |
| Events in quadrant A | 7,800,799 | 3,160,339 |
| Events in quadrant B | 8,598,986 | 3,181,909 |
| Events in quadrant C | 7,816,739 | 3,036,758 |
| Events in quadrant D | 34,863,442 | 2,460,974 |
| Mode M0 | |||
|---|---|---|---|
| Quadrant | BADHDUFLAG | Total packets | Discarded packets |
| A | 0 | 80147 | 0 |
| B | 0 | 82967 | 0 |
| C | 0 | 81126 | 0 |
| D | 0 | 196311 | 0 |
| Mode M9 | |||
|---|---|---|---|
| Quadrant | BADHDUFLAG | Total packets | Discarded packets |
| A | 0 | 40 | 0 |
| B | 0 | 40 | 0 |
| C | 0 | 40 | 0 |
| D | 0 | 40 | 0 |
| Mode SS | |||
|---|---|---|---|
| Quadrant | BADHDUFLAG | Total packets | Discarded packets |
| A | 0 | 796 | 0 |
| B | 0 | 796 | 0 |
| C | 0 | 796 | 0 |
| D | 0 | 796 | 0 |
| Quadrant | Total seconds | Saturated seconds | Saturation percentage |
|---|---|---|---|
| A | 39104 | 239 | 0.611191% |
| B | 39104 | 435 | 1.112418% |
| C | 39104 | 414 | 1.058715% |
| D | 39104 | 11996 | 30.677169% |
Noise dominated data is calculated using 1-second bins in cleaned event files. If a bin has >2000 counts, and if more than 50% of those come from <1% of pixels, then it is considered to be noise-dominated and hence unusable.
| Quadrant | # 1 sec bins | Bins with >0 counts | Bins with >2000 counts | High rate bins dominated by noise | Noise dominated (total time) | Noise dominated (detector-on time) | Marked lightcurve |
|---|---|---|---|---|---|---|---|
| A | 43044 | 39102 | 0 | 0 | 0.00% | 0.00% |  |
| B | 43044 | 39101 | 13 | 13 | 0.03% | 0.03% |  |
| C | 43044 | 39101 | 2 | 2 | 0.00% | 0.01% |  |
| D | 43043 | 39097 | 368 | 368 | 0.85% | 0.94% |  |
Top three noisy pixels from each quadrant. If the there are fewer than three noisy pixels in the level2.evt file, extra rows are filled as -1
| Pixel properties | Quadrant properties | ||||||
|---|---|---|---|---|---|---|---|
| Quadrant | DetID | PixID | Counts | Sigma | Mean | Median | Sigma |
| A | 4 | 2 | 64341 | 142.77 | 1992 | 1951 | 437.0 |
| A | 13 | 254 | 35653 | 77.12 | 1992 | 1951 | 437.0 |
| A | 3 | 1 | 18669 | 38.26 | 1992 | 1951 | 437.0 |
| B | 7 | 220 | 154627 | 402.09 | 1998 | 1945 | 379.7 |
| B | 6 | 36 | 140129 | 363.91 | 1998 | 1945 | 379.7 |
| B | 3 | 64 | 124937 | 323.9 | 1998 | 1945 | 379.7 |
| C | 9 | 54 | 220330 | 483.11 | 1914 | 1901 | 452.1 |
| C | 3 | 233 | 64235 | 137.87 | 1914 | 1901 | 452.1 |
| C | 5 | 112 | 40700 | 85.81 | 1914 | 1901 | 452.1 |
| D | 10 | 66 | 17904412 | 43909.94 | 1728 | 1666 | 407.7 |
| D | 7 | 238 | 3533870 | 8663.41 | 1728 | 1666 | 407.7 |
| D | 1 | 52 | 3179970 | 7795.4 | 1728 | 1666 | 407.7 |
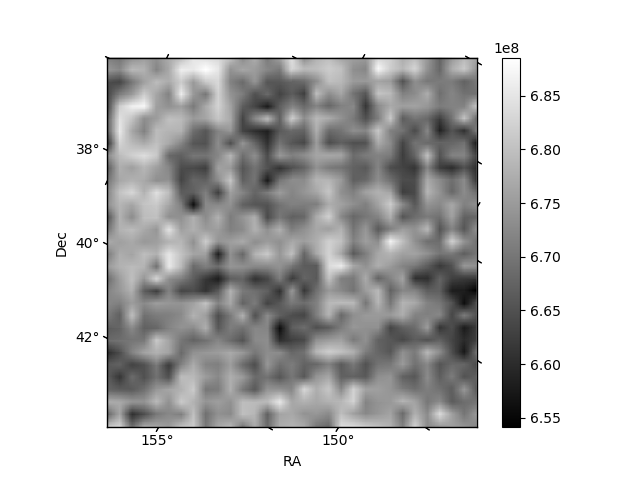
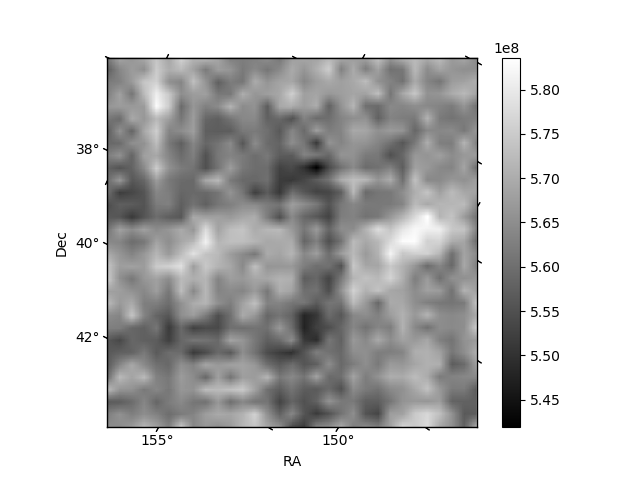
Histogram calculated using DETX and DETY for each event in the final _common_clean file
| Quadrant A |  |
 |
Quadrant B |
|---|---|---|---|
| Quadrant D |  |
 |
Quadrant C |
| Plot type | Count rate plots | Images |
|---|---|---|
| Comparison with Poisson distribution Blue bars denote a histogram of data divided into 1 sec bins. Red curve is a Poisson curve with rate = median count rate of data. |
 |
 |
| Quadrant-wise count rates Data is divided into 100 sec bins |
 |
|
| Module-wise count rates for Quadrant A Data is divided into 100 sec bins |
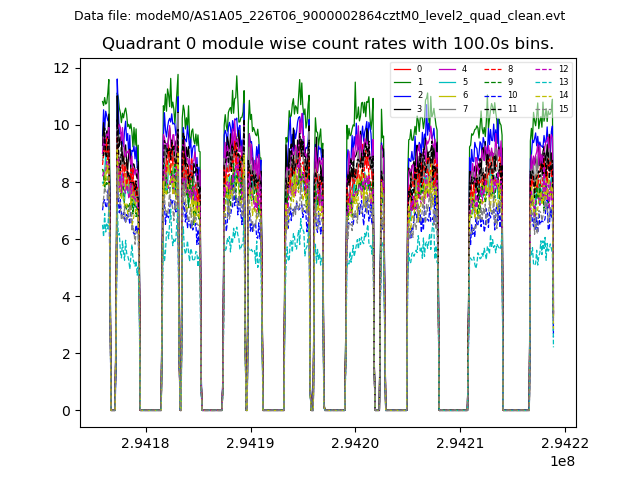 |
 |
| Module-wise count rates for Quadrant B Data is divided into 100 sec bins |
 |
 |
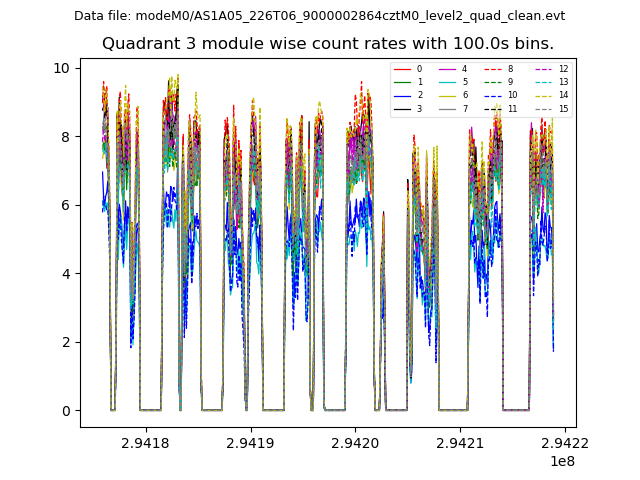
| Module-wise count rates for Quadrant C Data is divided into 100 sec bins |
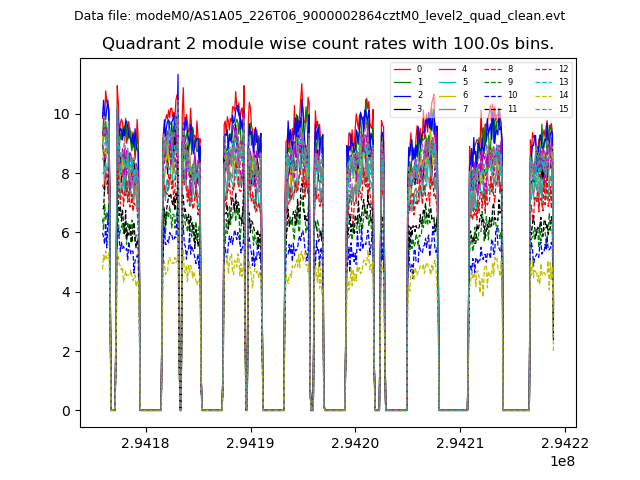 |
 |
| Module-wise count rates for Quadrant D Data is divided into 100 sec bins |
 |
 |
| Parameter | Plot |
|---|---|
| CZT HV Monitor |  |
| D_VDD |  |
| Temperature 1 | 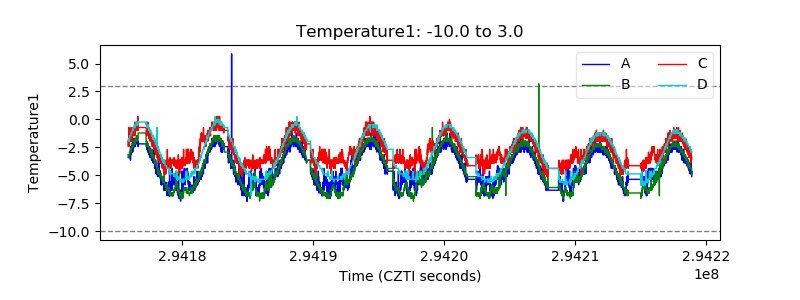 |
| Veto HV Monitor |  |
| Veto LLD |  |
| Alpha Counter | 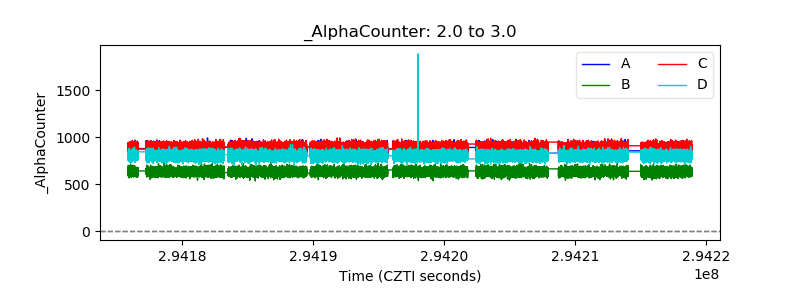 |
| _CPM_Rate |  |
| CZT Counter |  |
| +2.5 Volts monitor |  |
| +5 Volts monitor |  |
| _ROLL_ROT |  |
| _Roll_DEC |  |
| _Roll_RA |  |
| Veto Counter |  |