| Param | Original file | Final file |
|---|---|---|
| Filename | modeM0/AS1A05_104T05_9000002860cztM0_level2_bc.evt | modeM0/AS1A05_104T05_9000002860cztM0_level2_quad_clean.evt |
| Size (bytes) | 714,519,360 | 201,245,760 |
| Size | 681.4 MB | 191.9 MB |
| Events in quadrant A | 3,051,637 | 1,345,081 |
| Events in quadrant B | 3,036,967 | 1,365,406 |
| Events in quadrant C | 2,936,374 | 1,327,383 |
| Events in quadrant D | 11,764,569 | 1,200,403 |
| Mode SS | |||
|---|---|---|---|
| Quadrant | BADHDUFLAG | Total packets | Discarded packets |
| A | 0 | 254 | 0 |
| B | 0 | 254 | 0 |
| C | 0 | 254 | 0 |
| D | 0 | 254 | 0 |
| Mode M0 | |||
|---|---|---|---|
| Quadrant | BADHDUFLAG | Total packets | Discarded packets |
| A | 0 | 27382 | 0 |
| B | 0 | 27338 | 0 |
| C | 0 | 27472 | 0 |
| D | 0 | 65345 | 0 |
| Mode M9 | |||
|---|---|---|---|
| Quadrant | BADHDUFLAG | Total packets | Discarded packets |
| A | 0 | 36 | 0 |
| B | 0 | 36 | 0 |
| C | 0 | 36 | 0 |
| D | 0 | 36 | 0 |
| Quadrant | Total seconds | Saturated seconds | Saturation percentage |
|---|---|---|---|
| A | 12395 | 174 | 1.403792% |
| B | 12395 | 195 | 1.573215% |
| C | 12395 | 222 | 1.791045% |
| D | 12395 | 3597 | 29.019766% |
Noise dominated data is calculated using 1-second bins in cleaned event files. If a bin has >2000 counts, and if more than 50% of those come from <1% of pixels, then it is considered to be noise-dominated and hence unusable.
| Quadrant | # 1 sec bins | Bins with >0 counts | Bins with >2000 counts | High rate bins dominated by noise | Noise dominated (total time) | Noise dominated (detector-on time) | Marked lightcurve |
|---|---|---|---|---|---|---|---|
| A | 15079 | 12393 | 2 | 2 | 0.01% | 0.02% |  |
| B | 15079 | 12392 | 0 | 0 | 0.00% | 0.00% |  |
| C | 15080 | 12392 | 0 | 0 | 0.00% | 0.00% |  |
| D | 15079 | 12392 | 18 | 18 | 0.12% | 0.15% | 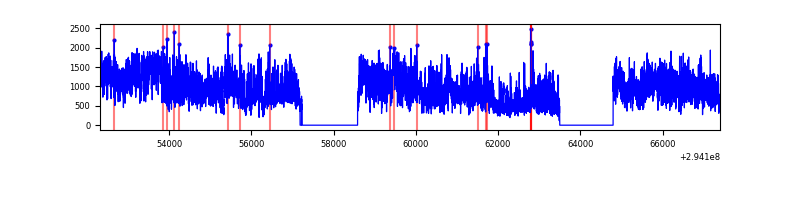 |
Top three noisy pixels from each quadrant. If the there are fewer than three noisy pixels in the level2.evt file, extra rows are filled as -1
| Pixel properties | Quadrant properties | ||||||
|---|---|---|---|---|---|---|---|
| Quadrant | DetID | PixID | Counts | Sigma | Mean | Median | Sigma |
| A | 4 | 2 | 72788 | 442.21 | 769 | 758 | 162.9 |
| A | 13 | 254 | 10822 | 61.79 | 769 | 758 | 162.9 |
| A | 12 | 96 | 7983 | 44.36 | 769 | 758 | 162.9 |
| B | 0 | 230 | 39713 | 271.7 | 779 | 764 | 143.4 |
| B | 0 | 198 | 11180 | 72.66 | 779 | 764 | 143.4 |
| B | 0 | 229 | 8454 | 53.64 | 779 | 764 | 143.4 |
| C | 3 | 233 | 23555 | 130.65 | 754 | 753 | 174.5 |
| C | 9 | 54 | 11498 | 61.57 | 754 | 753 | 174.5 |
| C | 13 | 61 | 4340 | 20.55 | 754 | 753 | 174.5 |
| D | 10 | 66 | 8396636 | 53048.42 | 683 | 662 | 158.3 |
| D | 1 | 52 | 425867 | 2686.58 | 683 | 662 | 158.3 |
| D | 11 | 176 | 138591 | 871.48 | 683 | 662 | 158.3 |
Histogram calculated using DETX and DETY for each event in the final _common_clean file
| Quadrant A |  |
 |
Quadrant B |
|---|---|---|---|
| Quadrant D |  |
 |
Quadrant C |
| Plot type | Count rate plots | Images |
|---|---|---|
| Comparison with Poisson distribution Blue bars denote a histogram of data divided into 1 sec bins. Red curve is a Poisson curve with rate = median count rate of data. |
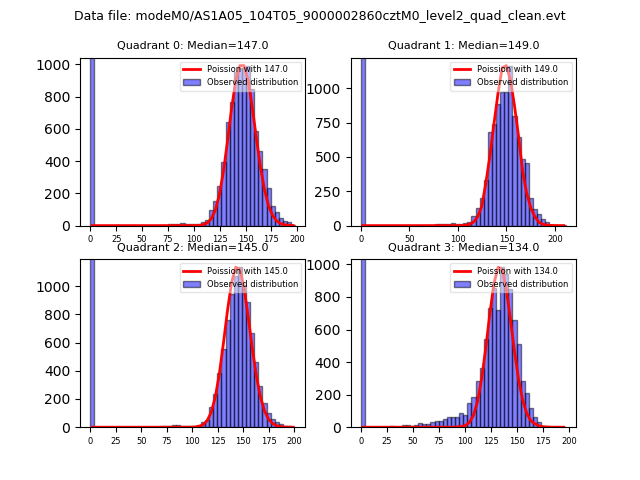 |
 |
| Quadrant-wise count rates Data is divided into 100 sec bins |
 |
|
| Module-wise count rates for Quadrant A Data is divided into 100 sec bins |
 |
 |
| Module-wise count rates for Quadrant B Data is divided into 100 sec bins |
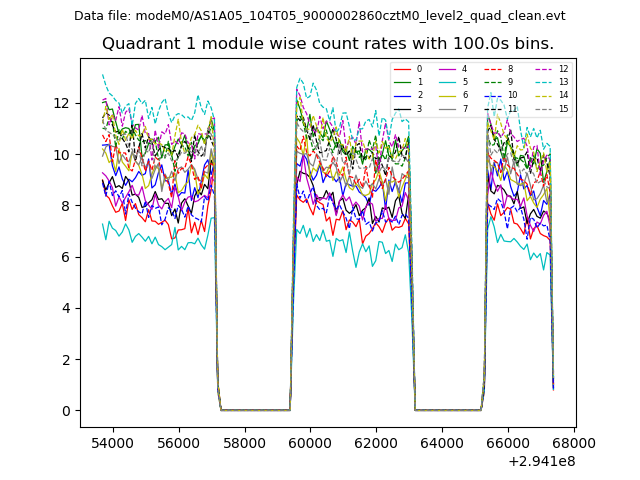 |
 |
| Module-wise count rates for Quadrant C Data is divided into 100 sec bins |
 |
 |
| Module-wise count rates for Quadrant D Data is divided into 100 sec bins |
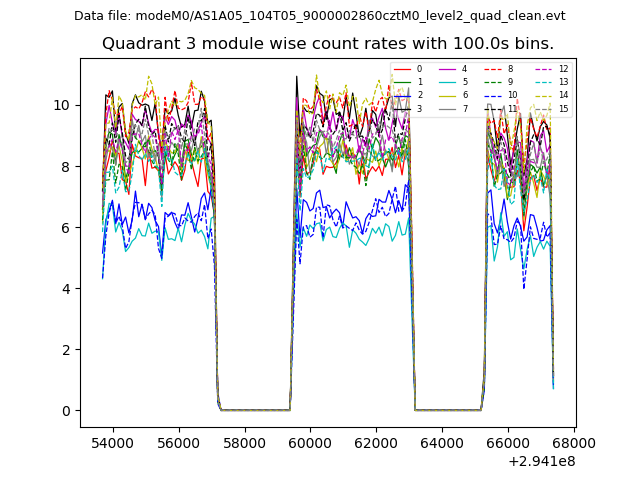 |
 |
| Parameter | Plot |
|---|---|
| CZT HV Monitor |  |
| D_VDD |  |
| Temperature 1 |  |
| Veto HV Monitor |  |
| Veto LLD |  |
| Alpha Counter | 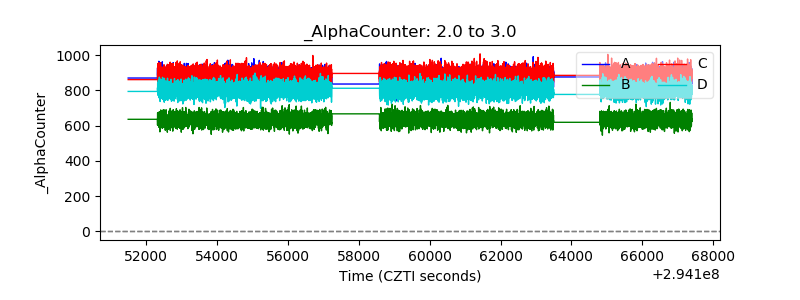 |
| _CPM_Rate | 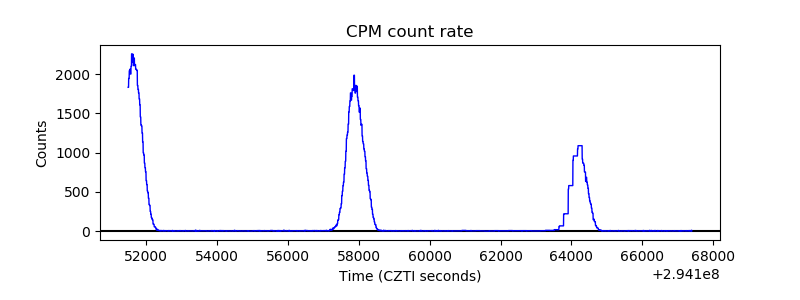 |
| CZT Counter | 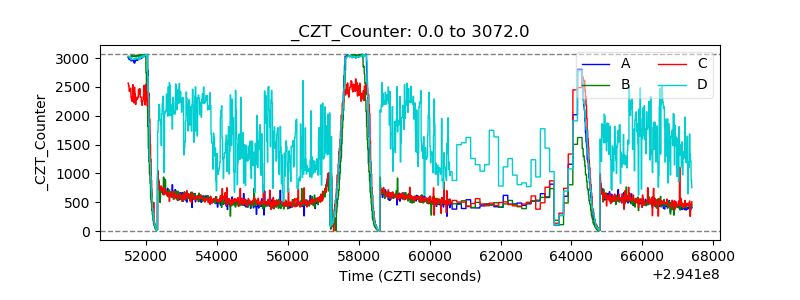 |
| +2.5 Volts monitor |  |
| +5 Volts monitor | 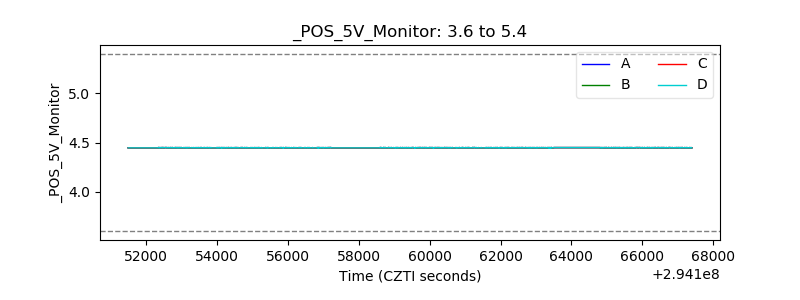 |
| _ROLL_ROT |  |
| _Roll_DEC |  |
| _Roll_RA |  |
| Veto Counter |  |