| Param | Original file | Final file |
|---|---|---|
| Filename | modeM0/AS1T03_099T03_9000002854cztM0_level2_bc.evt | modeM0/AS1T03_099T03_9000002854cztM0_level2_quad_clean.evt |
| Size (bytes) | 1,910,004,480 | 781,738,560 |
| Size | 1.8 GB | 745.5 MB |
| Events in quadrant A | 10,403,175 | 5,261,246 |
| Events in quadrant B | 10,982,300 | 5,313,093 |
| Events in quadrant C | 9,712,984 | 5,041,275 |
| Events in quadrant D | 23,506,461 | 4,803,213 |
| Mode SS | |||
|---|---|---|---|
| Quadrant | BADHDUFLAG | Total packets | Discarded packets |
| A | 0 | 970 | 0 |
| B | 0 | 970 | 0 |
| C | 0 | 970 | 0 |
| D | 0 | 970 | 0 |
| Mode M9 | |||
|---|---|---|---|
| Quadrant | BADHDUFLAG | Total packets | Discarded packets |
| A | 0 | 96 | 0 |
| B | 0 | 96 | 0 |
| C | 0 | 96 | 0 |
| D | 0 | 96 | 0 |
| Mode M0 | |||
|---|---|---|---|
| Quadrant | BADHDUFLAG | Total packets | Discarded packets |
| A | 0 | 99642 | 0 |
| B | 0 | 101510 | 0 |
| C | 0 | 99051 | 0 |
| D | 0 | 146025 | 0 |
| Quadrant | Total seconds | Saturated seconds | Saturation percentage |
|---|---|---|---|
| A | 47505 | 500 | 1.052521% |
| B | 47505 | 674 | 1.418798% |
| C | 47505 | 659 | 1.387222% |
| D | 47505 | 4870 | 10.251552% |
Noise dominated data is calculated using 1-second bins in cleaned event files. If a bin has >2000 counts, and if more than 50% of those come from <1% of pixels, then it is considered to be noise-dominated and hence unusable.
| Quadrant | # 1 sec bins | Bins with >0 counts | Bins with >2000 counts | High rate bins dominated by noise | Noise dominated (total time) | Noise dominated (detector-on time) | Marked lightcurve |
|---|---|---|---|---|---|---|---|
| A | 57220 | 47498 | 4 | 4 | 0.01% | 0.01% |  |
| B | 57220 | 47498 | 25 | 25 | 0.04% | 0.05% |  |
| C | 57220 | 47500 | 1 | 1 | 0.00% | 0.00% |  |
| D | 57220 | 47498 | 2337 | 2337 | 4.08% | 4.92% |  |
Top three noisy pixels from each quadrant. If the there are fewer than three noisy pixels in the level2.evt file, extra rows are filled as -1
| Pixel properties | Quadrant properties | ||||||
|---|---|---|---|---|---|---|---|
| Quadrant | DetID | PixID | Counts | Sigma | Mean | Median | Sigma |
| A | 5 | 168 | 162336 | 282.25 | 2600 | 2561 | 566.1 |
| A | 4 | 2 | 139124 | 241.25 | 2600 | 2561 | 566.1 |
| A | 13 | 254 | 61597 | 104.29 | 2600 | 2561 | 566.1 |
| B | 3 | 64 | 258628 | 519.84 | 2603 | 2541 | 492.6 |
| B | 7 | 220 | 202542 | 405.99 | 2603 | 2541 | 492.6 |
| B | 0 | 229 | 120589 | 239.63 | 2603 | 2541 | 492.6 |
| C | 5 | 112 | 81384 | 137.23 | 2460 | 2452 | 575.2 |
| C | 3 | 233 | 66095 | 110.65 | 2460 | 2452 | 575.2 |
| C | 9 | 15 | 57225 | 95.23 | 2460 | 2452 | 575.2 |
| D | 7 | 223 | 6577442 | 11710.68 | 2411 | 2331 | 561.5 |
| D | 7 | 238 | 3787330 | 6741.32 | 2411 | 2331 | 561.5 |
| D | 1 | 52 | 1857478 | 3304.13 | 2411 | 2331 | 561.5 |
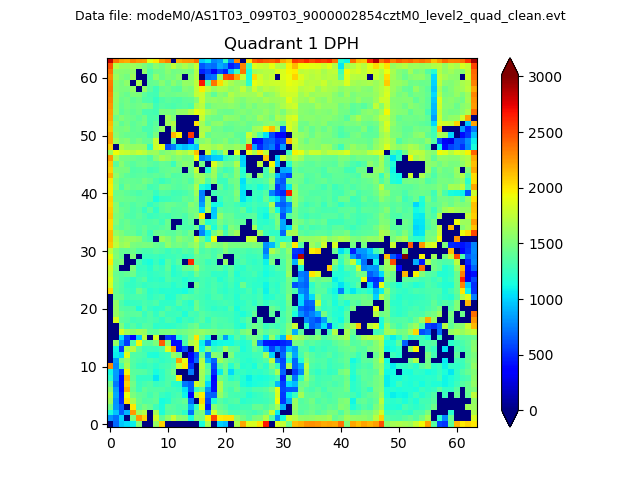
Histogram calculated using DETX and DETY for each event in the final _common_clean file
| Quadrant A |  |
 |
Quadrant B |
|---|---|---|---|
| Quadrant D | 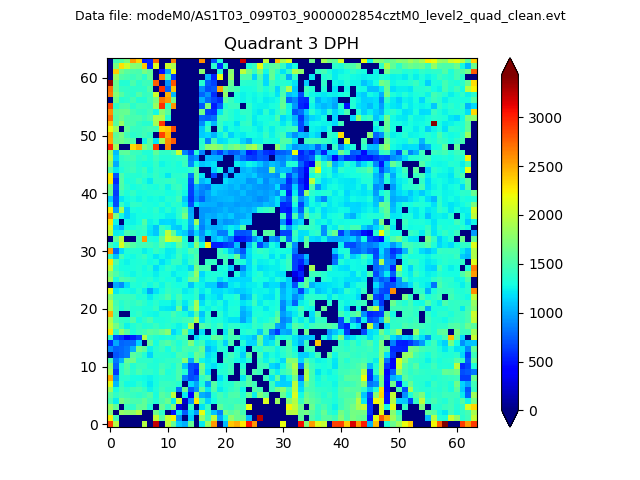 |
 |
Quadrant C |
| Plot type | Count rate plots | Images |
|---|---|---|
| Comparison with Poisson distribution Blue bars denote a histogram of data divided into 1 sec bins. Red curve is a Poisson curve with rate = median count rate of data. |
 |
 |
| Quadrant-wise count rates Data is divided into 100 sec bins |
 |
|
| Module-wise count rates for Quadrant A Data is divided into 100 sec bins |
 |
 |
| Module-wise count rates for Quadrant B Data is divided into 100 sec bins |
 |
 |
| Module-wise count rates for Quadrant C Data is divided into 100 sec bins |
 |
 |
| Module-wise count rates for Quadrant D Data is divided into 100 sec bins |
 |
 |
| Parameter | Plot |
|---|---|
| CZT HV Monitor |  |
| D_VDD |  |
| Temperature 1 | 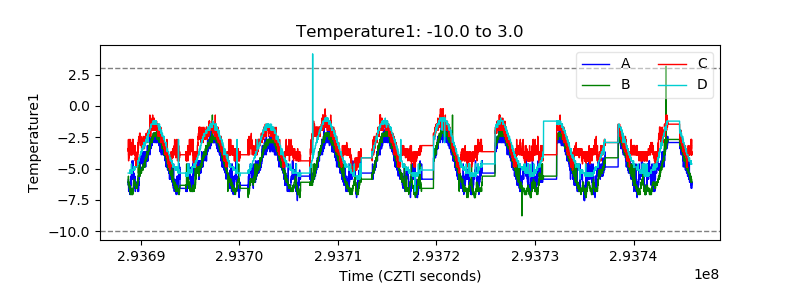 |
| Veto HV Monitor |  |
| Veto LLD |  |
| Alpha Counter |  |
| _CPM_Rate |  |
| CZT Counter |  |
| +2.5 Volts monitor | 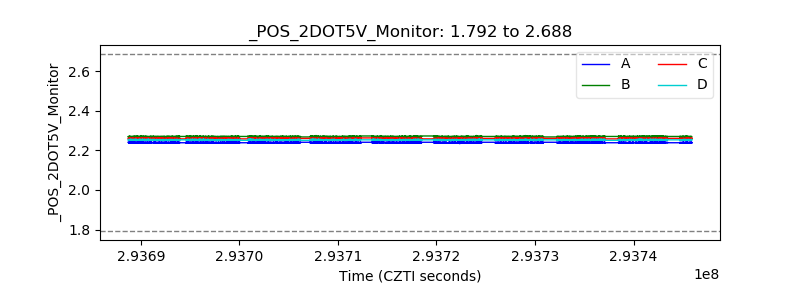 |
| +5 Volts monitor |  |
| _ROLL_ROT |  |
| _Roll_DEC |  |
| _Roll_RA |  |
| Veto Counter |  |